The Colors and Wavelengths of LightJasleen Singh
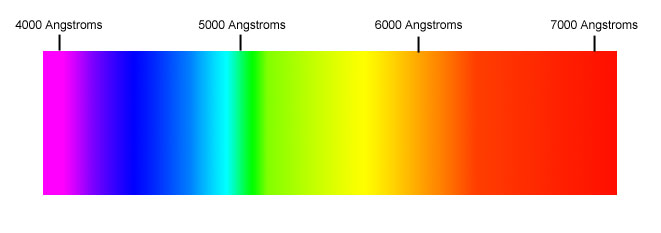
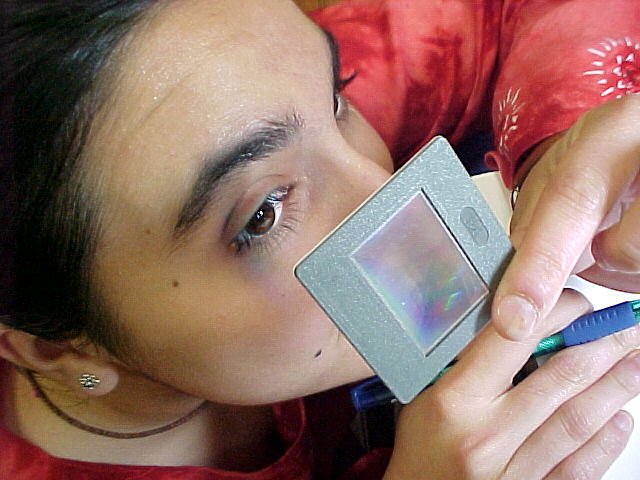
IntroductionColors and tricks with light have always enthralled me. I remember going to a light festival near my house and being left in awe by the brightness then dimness of the various colors of light. In school I also saw students making kaleidoscopes, a toy in which the bending of light along the angles of the mirrors creates a play of artistry. Though light has multiple aspects, my main interest lies in its component colors. This is why I decided to pursue a project dealing with light and color spectra in Dr. Noe's Laser Teaching Center. üĀüĀüĀ Background InformationDifferent wavelengths of light appear to our eyes as different colors. (Wavelength is defined to be the distance between two successive peaks of a light wave.)üĀVisible light waves having shorter wavelengths appear blue or violet; while light with longer wavelengths appear red. The colors in the rainbow are the "basic spectrum" from which all the light we see is composed. These colors such as red, orange, yellow, green, blue, indigo and violet form the spectral colors which are made up of their respective spectral components. üĀ The wavelengths of light marked on the visible spectrum are in Angstroms. The order of colors in light, arranged from shortest wavelength to longest, is called the visible spectrum of light. The image above shows light's visible spectrum, which runs from violet to red. One may recognize the spectrum as the order of colors in a rainbow. My project centered around the spectra of colors produced by an ordinary incandescent lamp, a fluorescent night light, and a special "full spectrum" fluorescent light, an "Ott-Lite." The specific colors emitted by each of the three light sources were observed with the help of a diffraction grating and a camera. These colors where then compared to the spectrum of a mercury lamp to infer the presence of mercury in the two fluorescent light sources. Just on a side note, the presence of such chemical elements, in their excited state, is also the cause of colorful emissions during fireworks. Materials and ProcedureThe instrument that allows one to actually measure the wavelength of light is a diffraction grating, which is "a transparent or reflective optical plate ruled with fine parallel and evenly-spaced grooves." The incoming light wave is spread out as it passes between the grooves and light emerging in specific directions, which depend on the wavelength, is reinforced by interference. Thus, gratings can separate a beam of light into its component colors the way prisms do. You can learn more about how diffraction gratings work at these two web sites:
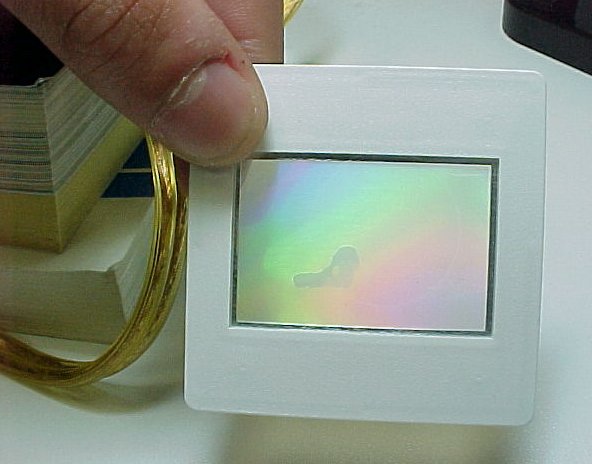
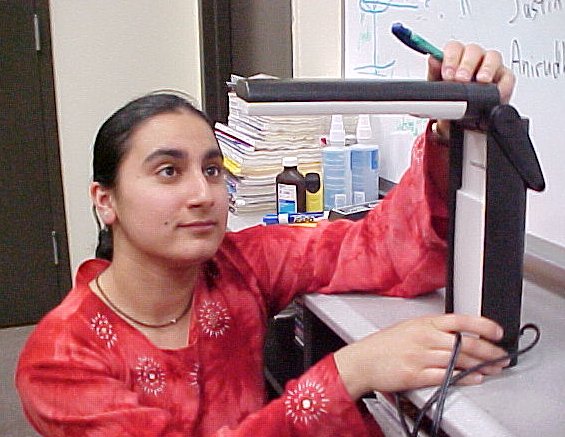
The diffraction grating, shown above, used in this study was measured by Sandy Xu to have an average line interval of 1333 nm, as described in her abstract. Sandy used a HeNe laser, which has a well known wavelength of 632.8 nm, and carefully measured the angle of the diffracted laser bean. Here are some pictures of the light sources I used. Click on the picture to see a larger size copy.
 üĀ üĀ
 üĀ üĀ
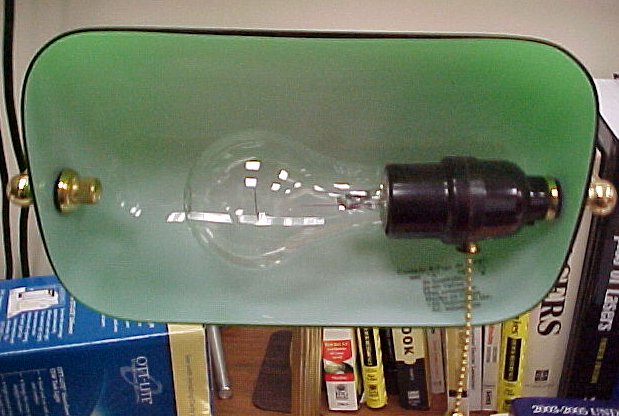
Incandescent lamp (left) and fluorescent night light (right) üĀüĀ
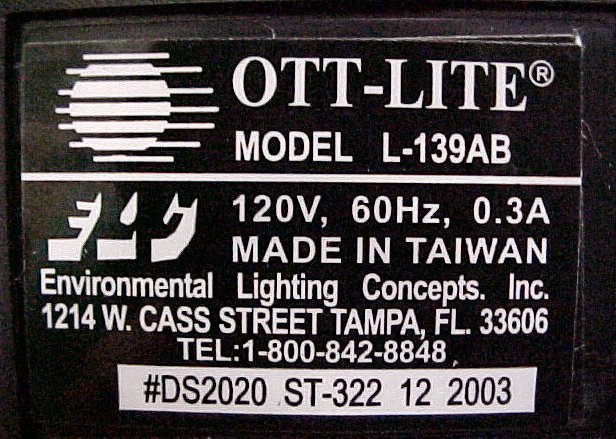
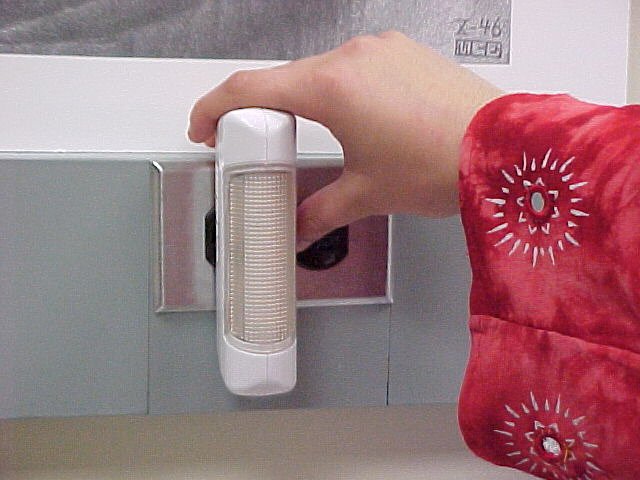
Full spectrum Ott-Lite The Ott-Lite is claimed to "replicate all the wavelengths in the visible spectrum of sunlight that is needed for the health of all living things." Dr. Noe bought this one at Staples, but you can also buy one at the Ott-Lite web site. Another essential piece of equipment is a simple slit to place in front of the light source.
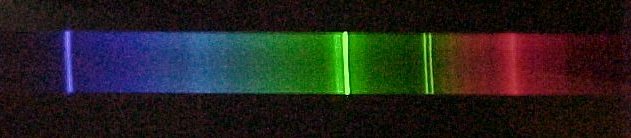
The two pictures shown above (right) are photographs of the color spectra produced by the Ott-Lite (using a slit) from two different distances from the light source.
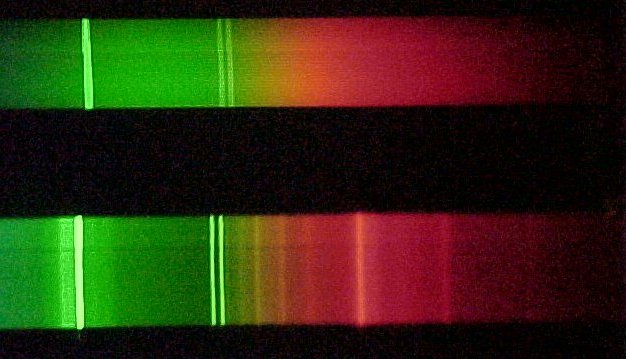
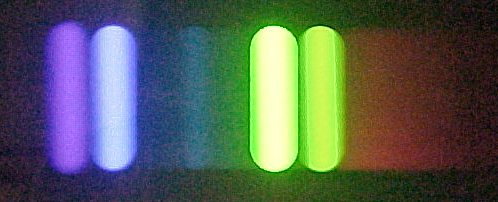
First Day - Playing AroundDuring the first day I worked individually in the lab with Dr. Noe, we started off by looking through the diffraction grating at a small fluorescent night light and then at a mercury lamp. To see each spectrum I had to look to the side rather than straight at the light source. The spectra from the two light sources were observed to be similar in some ways and different in others. In order to make a more precise comparison between the two spectra, we aligned the two lights with the fluorescent night light directly above the mercury lamp, as shown in the picture below on the left. The picture below on the right shows the two spectra that were produced in this way. 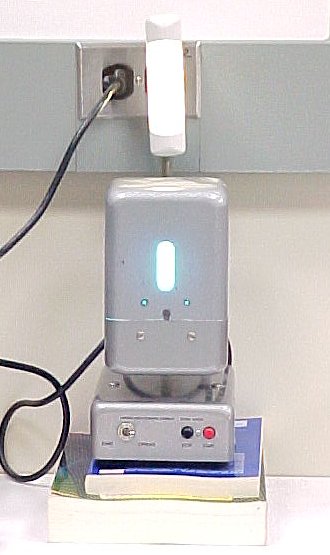

As mentioned before, the spectra from the two light sources were observed to be similar in some ways and different in others. The bottom spectrum has only narrow strands of color (called "spectral lines"), while the top spectrum has both a mixture of discrete lines and continuous spectral colors. On closer inspection, one of the lines in the mercury spectrum (bottom) can be seen to be a close doublet rather than a single line. Its color is actually yellow, but appears as green in the picture. Looking at the two spectra together in this way makes it apparent that the fluorescent light contains mercury; however the additional red color in the fluorescent light spectrum was due to the presence of white phosphor on the inside wall of the tube. Our observations further became conclusive when we found out thatüĀin a fluorescent light bulb the softness of the light in actuality, depends on the amount of harsh mercury colors being emitted. In order to create softer and more pleasant light, a fluorescent coating inside the glass is made to absorb the harsh mercury colors that are emitted and re-radiate the light at a longer wavelength (mostly red and yellow) to create a more even distribution of color. Learn more about fluorescent lamps. üĀüĀüĀOther Setups and ExperimentsOn some later days I returned to the lab to do some other experiments. These included looking at the spectra of an incandescent lamp and the Ott-Lite, and comparing the spectrum of the fluorescent night light looked at previously with that of the Ott-Lite. I also measured the positions of the spectral lines on one of the pictures and compared these to the wavelengths of mercury.Spectrum of an incandescent lampWe found that the spectrum of an ordinary incandescent light bulb -- unlike the mercury lamp -- consists of continuous range of bright colors without any sharp lines. This is because the source of the light is a hot filament rather than a gas containing a specific element.
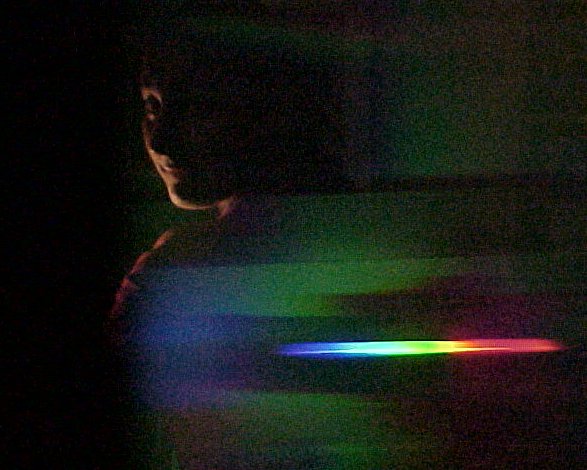
Spectrum of the Ott-LiteThe following two pictures compare the spectrum of the Ott-Lite that I observed with the spectrum of natural sunlight. Since the makers of the Ott-Lite claim that their light course replicates all the wavelengths in the visible spectrum of sunlight, I was interested to investigate whether such a claim was indeed reasonable for consumers to consider. üĀ When looking at the Ott-Lite spectrum along with that of natural light, we found that the two spectra closely resemble each other. Both spectra had a continuous range of colors, but in addition the Ott-Lite had several distinct strands of color that the visible color spectrum lacked. For example, the Ott-Lite was observed to emit a bright doublet of yellow light at slightly different wavelengths. The separation of the two lines was more easily distinguished as the distance between the light source and the optical grating was increased. We also two other strong lines (blue and green) and a number of fainter lines lines, which may be attributed to the phosphor in the tube.
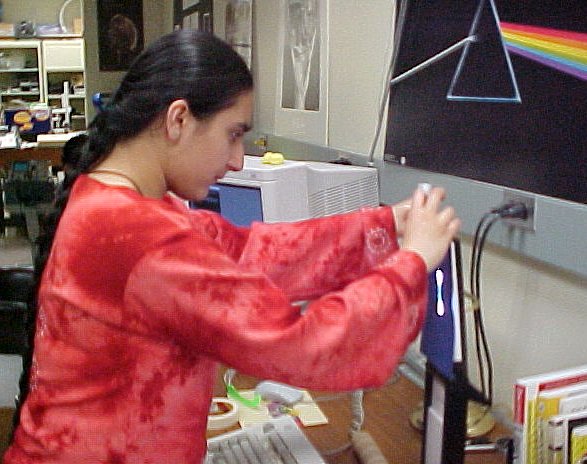
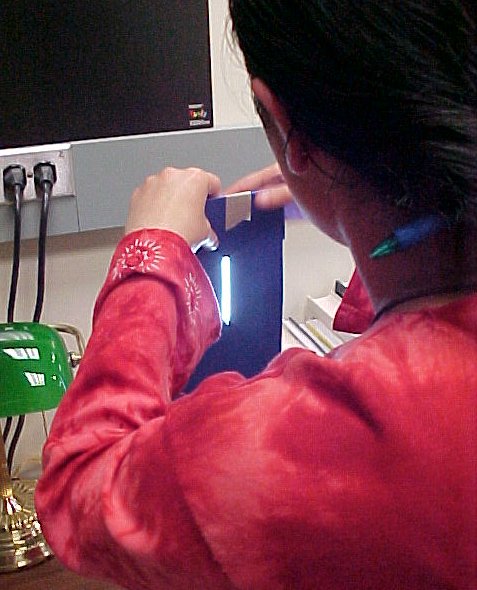
A closer look at the spectrum of the Ott-LiteOur next setup was done using the fluorescent night light and the Ott-Lite. The two pictures below show the setup created by cutting a slit (of equal width) through the poster board covering the two light sources, with the fluorescent light on the top and the Ott-Lite at the bottom. These slits limit the width of the light source observed through the diffraction grating.
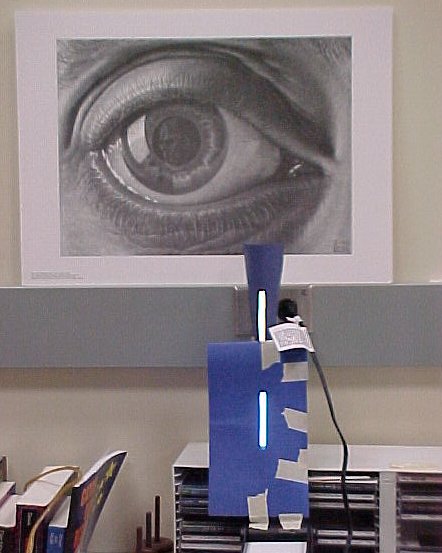
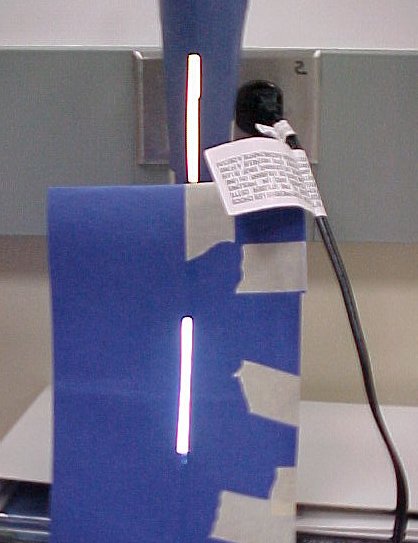
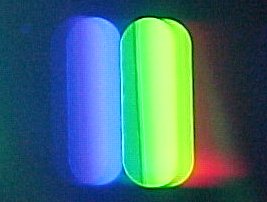
Two views of the spectrum produced by each of
üĀ
the two light sources in this setup are shown below.
When the spectrum produced from the Ott-Lite was compared to that produced from the fluorescent light we found that the wavelength of the green light emitted by the fluorescent light closely resembled the wavelength of the green spectrum from the Ott light (since the green strands produced by each of the two lights were found to be vertically aligned). It was also observed that unlike the fluorescent light spectrum, the Ott-Lite emitted a faint spectra of yellowish-brown color and a strand of sharp blue color. The presence of the yellow color in the spectrum may be due to the presence of sodium. üĀüĀ üĀ We analyzed the dominant colors in one of the pictures of the Ott-Lite spectrum (picture 006.jpg above) by reading off distance (measured in pixels) of each line starting from the left edge of the picture. We plotted these pixel values on a graph in comparison to known wavelength value of the blue, green and two yellow strands in the mercury spectrum.
Mercury Lines in the Ott-Lite Spectrum
As you can see, we found a very good linear relationship between the relative position of each line and the known wavelength of the specified color. The slope of the line was calculated to be 3.43 (pixels per nm). Using the observed distance (in pixels) between the two yellow spectral lines and the obtained slope of 3.43, we calculate the approximate wavelength difference of the yellow doublet to be 1.45 nm, which is close to the known wavelength difference of the doublet of 2.1 nm. In reference to Mr. Don Klipstein's expertise on fluorescent lamp we found out that the yellow and red lines in the "triphospor" fluorescent spectrum was due to the presence of phosphor and not any of the gas. The following weblink shows the spectrum of the "Ott" and fluorescent light source. The spectral lines on the reference link (above) also provided us with the wavelength and the actual spectrum of the two light sources. The two spectra, presented on the webpage, resembled the spectrum of the two Ott and fluorescent light sources that we obtained. The phosphor which forms the coating inside the fluorescent tube leads to the spectral output that we see as orangish-red spectral lines. The inside of the tube coated with a phosphor produces visible light when excited with ultra-violet (UV) radiation. Also, referring to the "color rendering index" (light source accuracy in reflecting color-- based upon a 0-100 scale) we found that the "Ott"and the fluorescentlight claim a color rendering index of 91 and 82, respectively. The CIR of the two light sources were much closer in value and spectral output. Thus, considering our findings and referring to Klipstein's viewpoint, the Ott-Lite was considered to have much of phosphor output from the usual "triphosphor" phosphor used in the compact fluorescent lamp. ConclusionsBy doing these mini experiments-in viewing different spectrums of colors from various light sources, I was able to compare and contrast one source of light from another. The fluorescent night light used in our lab was found to have a continour spectrum along with the specific colors of mercury. Thus, due to the presence of mercury in these fluorescent lamps, the dipossing off of these lamps must be done with precausion.Also looking the Ott-Lite spectrum and comparing it to that of our fluoresecnet night light, we found that even though the two specta seemed similar, there were several differences in the composition of light and intensity of spectral colors. The Ott-Lite, besides having mercury, also showed the output of mixed-"triphosphor". Also, the intensity of spectral lines were analyzed to be more in the Ott-Lite than in the fluorescent light source. Thus, inorder enhance the quality and CIR of these light sources, the makers manipulatively adjusting the elemental chemistry of their light sources. üĀüĀüĀ And above all else, by learning the application of physics in my investigation of the composition of light, I learned to use one of the most important physics tool in light experiments the optical diffraction grating. I am proud to have learned the application of physics in my experiment despite not having any formal physics background at all, thanks to Dr. Noe. I thank you Dr. Noe for your patience, understanding, encouragement and teaching me physics from scratch. üĀ
Touch-up Notes and References
|