Measuring the Absorption of Colors of Light
Introduction:
As you probably know, there are seven colors of light in a rainbow: Red, Orange, Yellow, Green, Blue, Indigo and Violet. (Some people skip Indigo and say there are really just six colors.) But did you know that different colors of light can have a big effect on the growth of plants?In my high school science class, I saw my teacher do experiments using lights with different colors in a dark room (no windows) to grow plants. It was amazing that some of these plants grew faster and better than plants grown under white light or sunlight. Since then, I have always wondered which particular color of light is the best for plants to absorb to grow the best. Therefore, when I got a chance to set up and control an experiment myself, I picked to measure how light of different colors is absorbed for my topic.
Experimental setup and procedure:
|
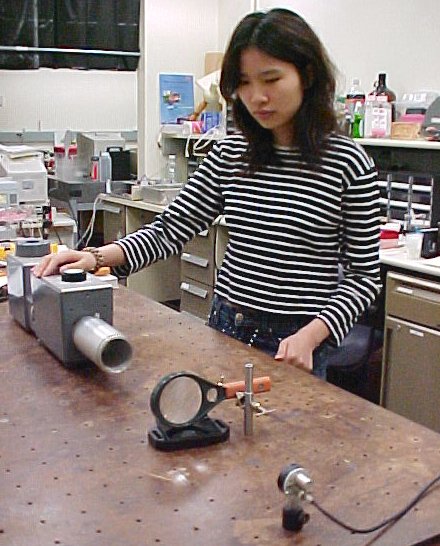
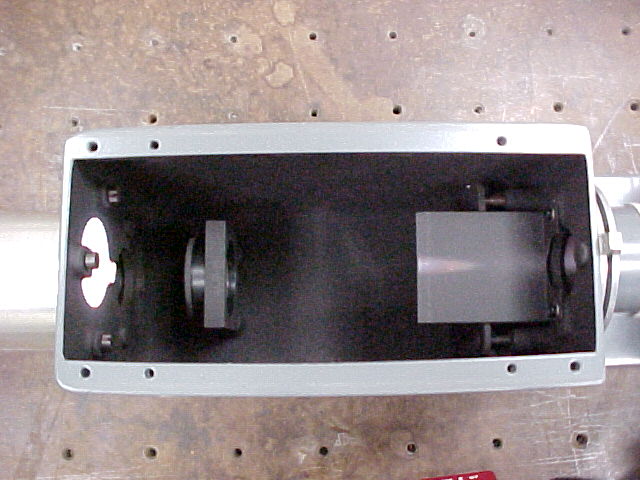
The setup has three parts: 1) a monochromator to create light of a single color at a
time; 2) a lens to focus the light; and 3) a detector to measure the light intensity.
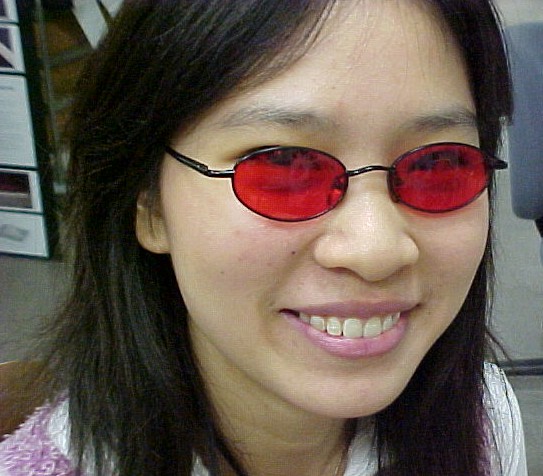
To measure the absorption curve of a sample, we measure the light intensity for a series of colors first without the sample (Io) and then with the sample in front of the detector (Is). The percent transmission is then given by the formula 100 x Is / Io. For the sample, it was too complicated to use green plants, so we used a pair of red-colored sunglasses borrowed from another student. |
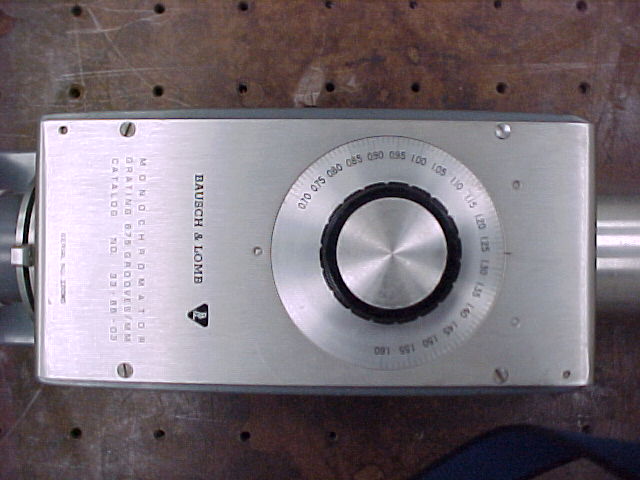
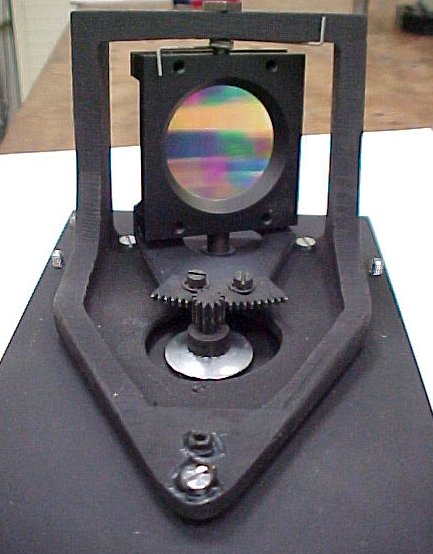
The color selector part of the monochromator
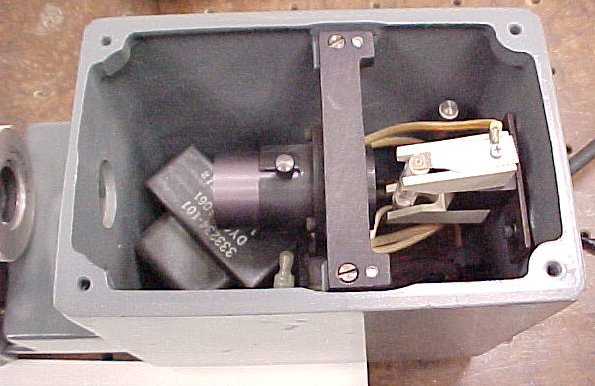
The light source part of the monochromator
Difficulties in the experiment
There were two difficulties in the experiment that made it necessary to repeat the measurements several times.The first problem was a loose dial on the instrument, so that the number on the dial for the same color kept changing. After this was fixed, the readings from the experiment were still very different from the numbers we expected. After a while, Dr. Noe found out that the high readings we get for green, blue, violet (without glasses) are due to a mixture of infrared light at double the wavelength. The detector is very sensitive to this light, but of course, we cannot see it. For example, if the instrument is set for 500 nm (blue-green) then 1000 nm infrared can also pass through. There is a lot of this infrared light from the hot lamp, and the detector is more sensitive to it than to blue or green. This explains why the readings went up 5 or 10 times higher for shorter wavelengths than green.
To test this idea, we used a filter that absorbs infrared light and Dr. Noe measured a complete set of points all over again, from 90 to 150 on the dial, under 4 conditions: with and without the filter, and with and without the glasses. Finally we got results we can believe! Dr. Noe explained that this is research and not just a set up experiment where some one else has already figured everything out. Real research is when we do not know what we are doing (at first), but we gradually figure things out.
Results
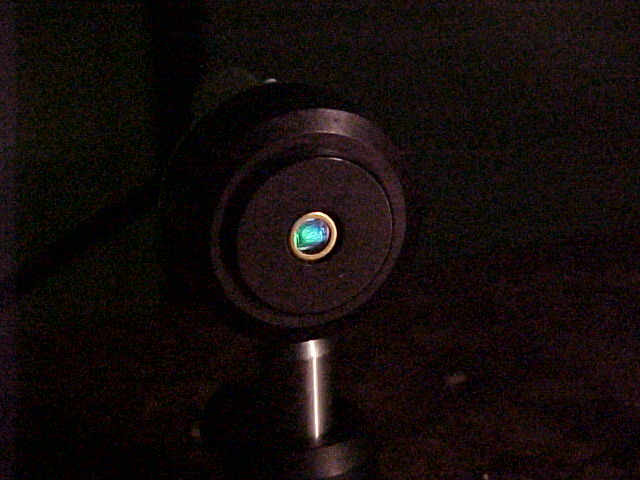
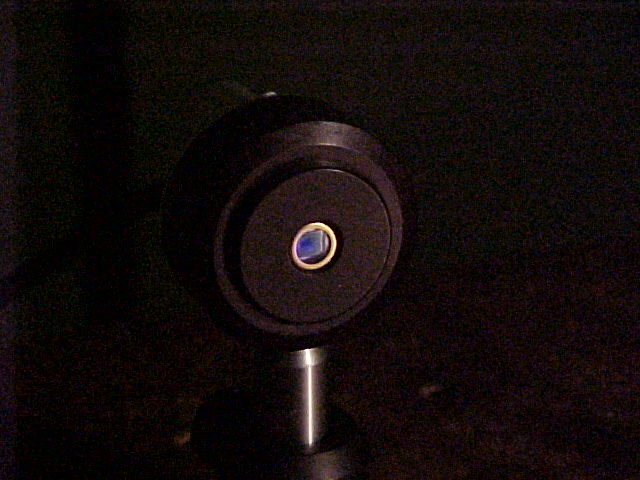
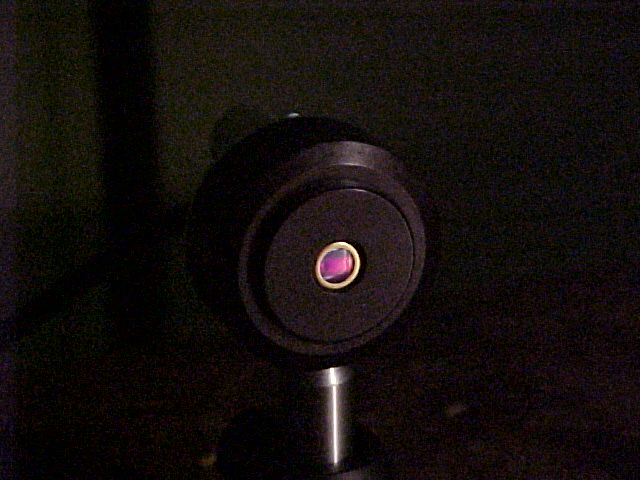
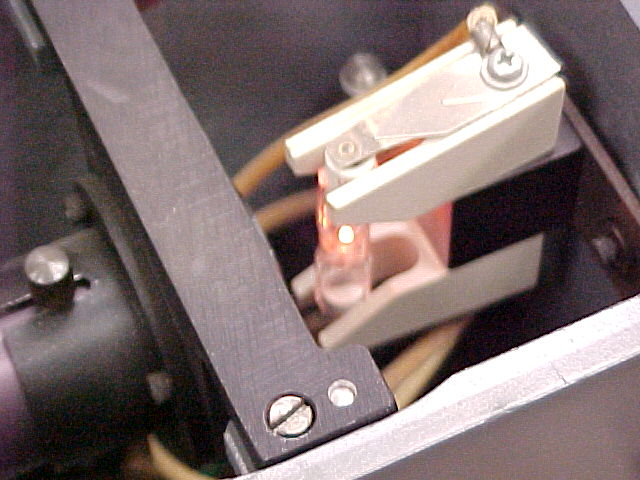
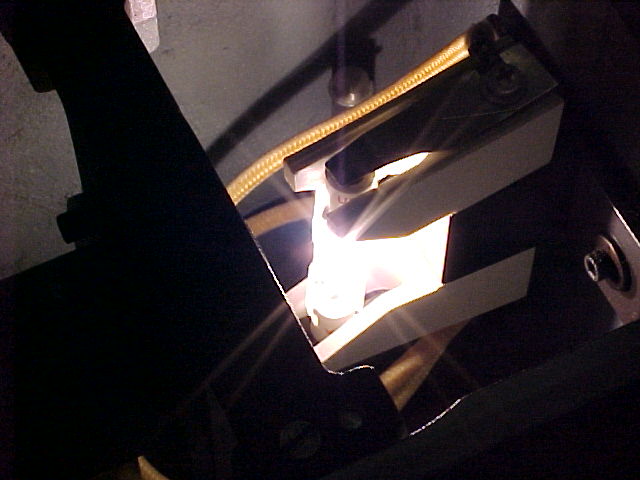
Close up of the detector with three colors of light selected
This graph shows my results. The color scale is: 100 = violet;
110 = blue; 115 = green; 125 = yellow; 130 = orange; 140 = red.
The sunglasses transmit more red and violet, but less green and blue, and the orange and yellow are in the middle. Therefore, the order of the light transmitted is red, violet, orange, yellow, green,and blue.
Some references to web sites to learn more
- The Physics of Color
- How does color of light influence the rate of photosynthesis?
- Chemical of the Week: Chlorophyll
- Yixi Chen / April 2002