The Single Mode Fiber
Huijie
Miao
SUNY
at Stony Brook
Optics
Rotation Project 1 at Laser Learning Center
Advisor:
Dr. John No谷
Outline
﹞ Introduction
﹞ Experimental Setup
﹞ Alignment Methods
﹞ Measurements and Results
﹞ Further Study
﹞ Acknowledgements
﹞ References
Introduction
Optics fibers have been an active research area in recent years, especially in telecommunication systems. It is very convenient to use fibers for long-distance signal transmission. The loss in fibers is very low, and also, they can carry a lot of channels. However, how can we introduce a laser into a fiber?
My main purpose of this project is to learn how to couple a laser light into an optics fiber, and study the intensity distribution of the output light. First I tried to couple a He-Ne laser into a single mode fiber. And then I tried the multiple mode fiber as well. It was really excited to see the various modes of the output light. Finally, I tried to study the intensity distribution of the output of a single mode fiber.
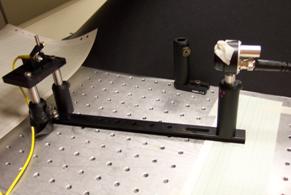
Experimental Setup
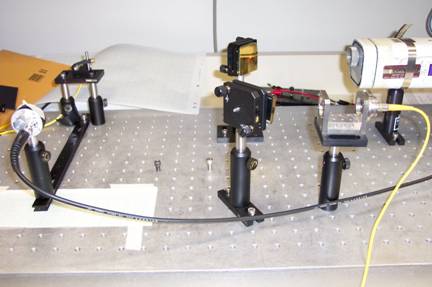
Apparatus:
- He-Ne
laser, wavelength 633 nm
- 2
mirrors: mirror 1 for x/y alignment, mirror 2 for angular adjustment
- PAF
fibre port
- Single
mode fibre
- Multi-mode
fiber
- Thorlabs
photo-detector, with 2MW load resistor
- Digital Multimeter
Alignment Method
1. Adjust the laser, mirrors and the PAF in order to make the laser on the same horizontal level. I used a hard board to sigh the position of the laser. It seemed quite effective.
2. Insert one end of the single mode fiber into the PAF gradually.
Meanwhile, adjust the mirrors again to couple the laser into the fiber. Because
the mirrors are coupled, we should adjust both the horizontal bolts first and
then both the vertical ones. Make sure the output spot is always brightest, and
then insert the fiber a little bit further. You will find the spot becomes
dark. Then adjust the mirrors again to get a brightest spot#Until insert the
fiber completely into the PAF.
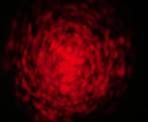
3. Then, I tried a multiple mode fibre. Follow
the procedure 2, and get a bright output. When I changed the position of the
mirrors slightly or even moved the fiber itself, an obvious changing of the
pattern of the output light could be observed.
4. I used another fiber. Also, when I changed the position of the mirrors,
some different patterns appeared.
Measurements and Results
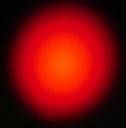
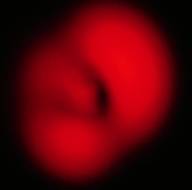
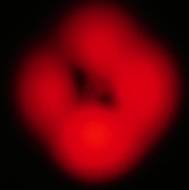
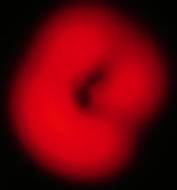
﹞ The output patterns of different kinds of fibers
Single-mode fibre
Multi-mode fibre
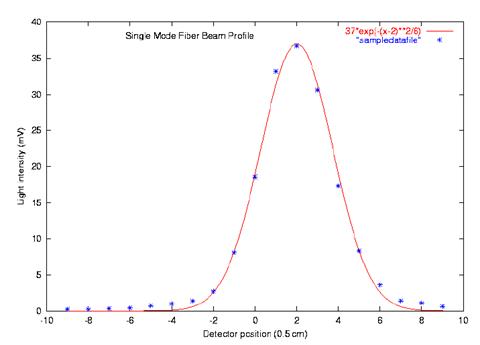
﹞ The measurement of the intensity distribution of the single-mode fiber
 Dx=0.5cm
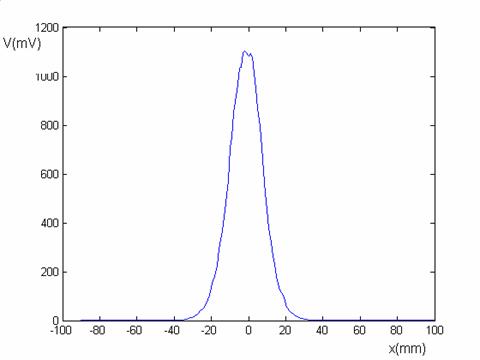
1. I fixed the position of the output end of the fiber, and put the detector 15.0 cm away from it (shown in the picture above). Move the detector along the x direction, and record the intensity of the point. To measure the intensity, I used a Thorlabs photo-detector with 2MW load resistor and a Digital Multimeter to read the voltage. The distribution of the intensity fits the Gaussian Function.
The intensity of the laser is 3.71V
The output intensity of the fiber is 1.53V
The background intensity is 0.0V.
Following is the diagram of the results:
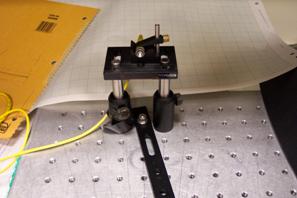
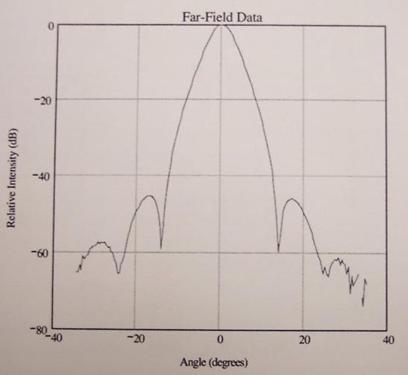
2. In the above measurement, the distance of from the fiber to the detector is not fixed. To get a even more accurate diagram, I fixed the distance and picked the voltage when changing the angle. Below is the apparatus I used.
![]() , L=25.50cm, Dx=1.0mm, So Dq=0.255 degrees.
, L=25.50cm, Dx=1.0mm, So Dq=0.255 degrees.
Background intensity=0.2 mV
I measured 192 points in all
Though a total arc of approximately 24.32 degrees each side

And the result fit the Gaussian Function quite well.
Further Study
According to some references because of the non-linear effects, the far-field intensity distribution does not totally follow the Gaussian Function. The first side-lobe can be found at around 20 degrees. However, in my experiment it seems not obvious. The reason is the resolution of our detector is not sensitive enough. If we use a detector 10 times more sensitive, the side 每lobe should be observed. For instance, we can increase the resistor up to 10MW, the maximum value of the voltage will be about 5V, and the side-lobe may be investigated.
Acknowledgement
During my experiment, Dr. John No谷 helped me a lot. He helped me to understand the physics and also to plot the graph and upload my results. Here I*d like to thank him for his generous help.
References
[1] Rob Billington,
Effective Area of Optical Fibers-Definition and Measurement Techniques, Centre
for Optical and Environmental Metrology
[2] Lifang Tang, Fiber
in Telecommunication
[3] Ajoy Ghatak, K.
Thyagarajan, Introduction To Fiber Optics