Introduction:We are all intrigued by the beautiful array of colors we see when observing an oil slick or a soap bubble. This phenomena sparks interest from the time we are infants creating soap bubbles for amusement all the way into adulthood. What many people don't realize is that there is a tremendous amount of physics being demonstrated in these magnificent colors. To fully understand the origin of these colors, one needs to create a mathematical model that embodies the laws of physics. In this report, vertical soap films were observed and the color patterns they display were quantitatively analyzed using a spreadsheet to evaluate formulas and plot graphs. Soap Film Observations:
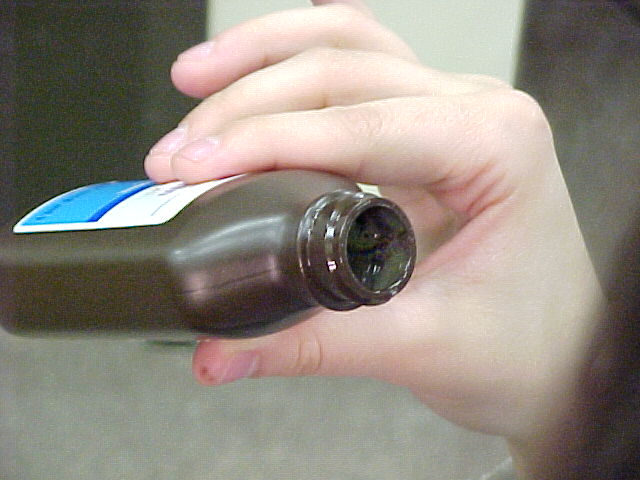
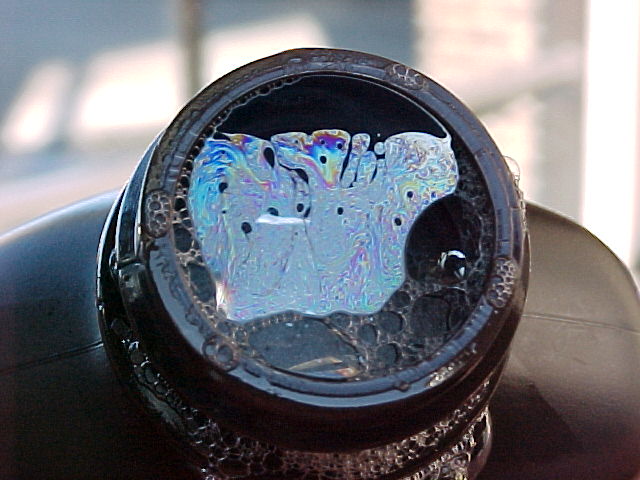
The soap films shown above consist roughly of equal parts water, glycerin, and Dawn dishwasher detergent. The picture to the left gives a visual idea as to how large the soap film is. The two other pictures demonstrate various phenomena that have been studied in this research. The center picture exhibits a distinct 'black band' at the top of the soap film. This band forms gradually over a period of several minutes when the film is held in an approximately vertical position. The picture to the right shows a white band at the top of the soap film just below a less recognizable black band. Below the white band are color bands of varying height. The colors that we see when observing a soap film are caused by interference of light reflecting off of two nearby surfaces -- the outer surface and the inner surface. If one starts with white light (a mixture of all the wavelengths of the visible spectrum from 400 to 700 nm), the interference enhances some wavelengths and diminishes others, creating visible colors. The specific wavelengths that are enhanced or diminished is determined by the thickness of the film and its index of refraction. Background Information:Index of refractionDifferent materials have different indices of refraction denoted as `n'. The index of refraction is defined as the speed of light in a vacuum `c' divided by the speed of light in the medium `v'.
The index of refraction of some common substances are given below.
(Reference: Hyperphysics web site.)
For the purpose of this research, it was assumed that a soap film has an index n = 1.332 since it often consists mostly of water. The actual index will be somewhat higher depending on the amount of glycerin in the mixture and the exact composition of the film. To learn more about the composition of soap films visit Hilary Fleischer's website. Fresnel equationAs is well known, the change in index of refraction as light moves from one medium to another determines the bending or refraction of light rays according to Snell's Law. This effect isn't relevant to this research however since we are limiting ourselves to the case where the light is at normal incidence (perpendicular) to the surface of the soap film. Less well known is that the index of refraction determines the amount of reflection that inevitably occurs at a boundary between two media. For light incident normally on a surface, the reflectance R is given by a simplified form of the Fresnel equations:
For a soap film of index n = 1.332 in air (n = 1), the reflectance calculated from this formula is 2.0%. For glass, which has a higher index (n = 1.52 typically) the reflectance is about twice as much, or 4.0%. The transmittance T is simply 1 - R. Phase change upon reflectionThere is a fundamental concept that must be understood when light which is initially moving in one medium of index n1 reflects from the boundary between that medium and a second medium with index n2. This is that there is a 180 degree phase shift, or no phase shift, depending on whether or not the index of the second medium is greater than the index of the first medium.
Thus, for a soap film in air, there is a phase reversal at the closer or front surface, but no phase change at the further away or back surface. Black Band Explained:The existence of a phase change at one soap - water interface but not the other explains why a black band forms at the top of the soap film. The existence of the black band is a direct result of these phase changes along with a decreased thickness near the top of the bubble. As a result of gravitational effects, the water molecules are constantly being pulled downward causing the soap film to become `wedge-shaped'. This effect causes the film to become thinner at the top. As stated earlier, light rays reflected from the outer surface with a phase change of 180 degrees will recombine with waves that have been reflected off of inner surface with no phase change. When the film becomes so thin (less than 10 nm) that its thickness causes an insignificant phase shift, the result is complete destructive interference of the two light waves. Hence the black band we see at the top of the soap film. Color Bands:Below the black band, there are color bands present. The colors we see in these bands as well as the thickness of the color bands themselves depend on the thickness of the soap film at that point and the index of refraction. A light wave traveling through a transparent film such as a soap film will reflect and transmit as stated earlier. The transmitted wave will travel twice the thickness of the film (at normal incidence) before re-encountering the wave reflected on outer surface. The extra distance the light wave travels is known as the `Path Length Difference' denoted as:
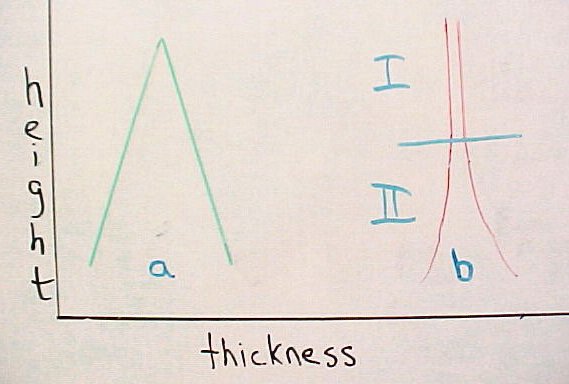
(where 't' is the thickness of the film and 'n' is the index of refraction) The path length difference has a direct relationship with the amount of constructive or destructive interference that occurs when these light waves superimpose outside of the soap film. The greater the angle of incidence of light on the surface of a soap film, the greater the path length difference would be. This would create the need for a cosine term in our equation. (For simplicity, this research involved light at normal incidence). When observing the color bands in the soap film, the color bands were of different thickness' themselves as well as spaced differently. If the film was indeed wedge shaped, each color band would be spaced equidistant from one another. However, by looking at picture 'C', it can be seen that the color bands get closer and closer together as we approach the bottom of the film. In my research I have found that the soap film does indeed have a `wedge-like' shape, however it seems there is a distinct region where the shape of the soap film changes slightly. It is apparent that the change from the black region to the colored regions is not gradual. In fact, the change is quite abrupt. This would lead one to think that the area of the soap bubble hosting the black region is relatively uniform in thickness while the rest of the bubble changes in thickness as one moves down the bubble. To explain why the color bands are of different thickness' themselves as well as being spaced unequally, the slope of the surface in this area must increase as we move upward toward the black region. A picture has been drawn showing intial conceptions of the shape of the soap bubble 'a' and what the soap bubble is thought to be shaped like now 'b'. Area I in picture 'b' would represent the black region and Area II would represent the area containing the color bands.
Creating the Mathematical ModelXS:Interference is not always totally constructive or destructive. When reflected waves aren't completely in phase or completely out of phase, the amplitudes of these waves add as vectors, resulting in different intensities of light for each wavelength. These waves superimpose themselves together on the outer surface of the bubble to produce these color bands. 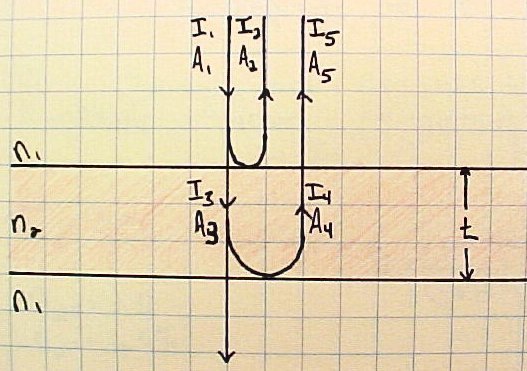 The above diagram summarizes the intensity of light after various reflections inside the soap film. The incident light was given an intitial intensity I = 100. The reflected and transmitted rays will then each have a different intensities according to the following formulas. It can be seen that I2 and I5 are the intensities of the light waves that will superimpose outside of the soap film to form a resultant wave.  Because light has a phase as well as an intensity, we have to combine two amplitudes (complex numbers or vectors) to calculate the phase change. If we regard the amplitudes as vectors, we can determine the amplitude of the resultant vector by using the law of cosines, as summarized in the diagram below. 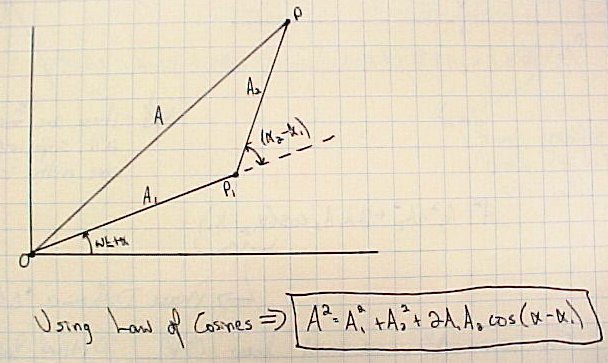 It is important to note that the above equation makes use of the 'amplitude' of a wave. In order to be able to plot the relative intensities the relation I = A2 must be utilized. The A12 will correspond to I2 and A22 will correspond to I5. Also, the phase change is given by the optical path length (which is the physical path length 2t times the index of refraction n) times 2 π / λ. An additional π term takes into account the phase change on the outer surface. Thus, the mathematical derivation for the formula to be used is as follows:  Intensity Plots and Discussion:The above formula was evaluated, and various plots created, with
the help of a spreadsheet program, QuattroPro. Two types of plots
were created. In the first type of plot the intensity was plotted as a
function of film thickness for four colors (red, green, blue and
violet, with wavelength 650, 550, 450 and 400 nm, respectively). In
the second type of plot the intensity was plotted as a function of
wavelength for a total of eight distinct film thickness values ranging
from 10 to 1000 nm. Two plots of each type were created, for a total
of four plots.
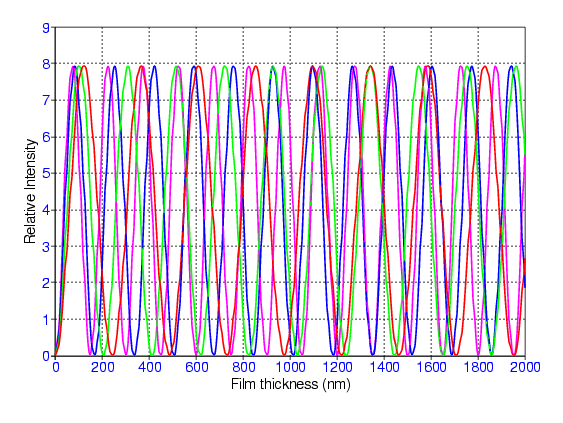
The plot above shows how all colors fall to zero intensity as the
thickness of the film goes to zero. This is consistent with the black
appearance of very thin films. All colors reach their first maximum
of intensity at around 100 nm. Each color then has additional
intensity maxima at larger thickness values, but the thickness
interval from one maximum to the next varies with the color. For
example, red light peaks at thickness values of 122, 365, 610, 855 nm,
etc, while blue light peaks at 85, 253, 422, 592 nm, etc. For certain
thickness values many colors are strong simultaneously, leading to a
relatively bright white appearance, while for other thickness values
such as 1200 nm no color is very strong, leading to a dim
appearance. At around 300 nm thickness, on the other hand, just one color (green)
dominates. The variations in strength of the various colors as
a function of thickness will create the type of colored bands
shown in Picture `C'.
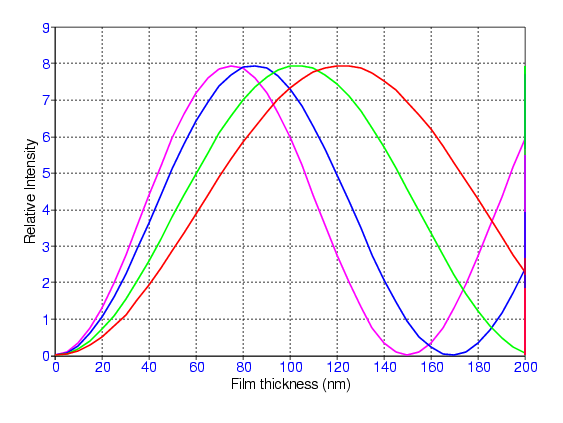
A second plot focusing on thickness values from 0 to 200 nm shows
more distinctly how the various colors all reach a maximum intensity
at a similar thickness of around 100 nm. This explains the white
appearance that occurs immediately below the black band on the film.
It is also apparent that the black region must be at most 10 nm
thick. 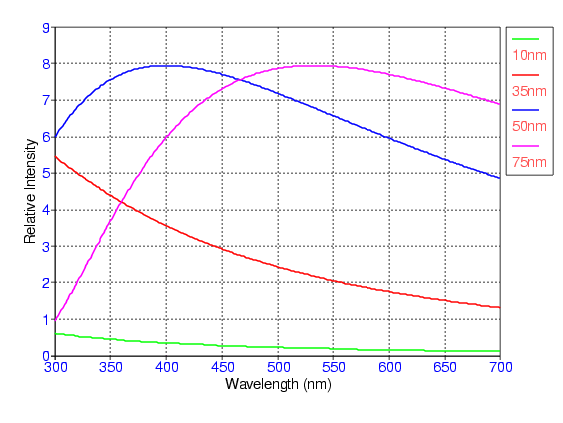
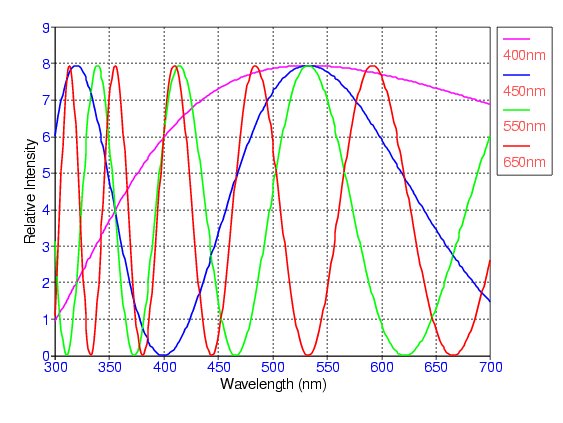
This graph shows the relative intensity at low thickness values as a function of wavelength. This is useful in determining what colors will be observed at a given thickness. It is important to note that the colored lines in the graph do not represent colors themselves. The legend shows that each colored line represents a certain thickness. For example, the blue line represents a thickness 50 nm. If one follows the peak intensity of the blue line, it is clear that violet would be observed. The graph below is the same type of graph focusing more on greater thickness'.
Suggestions for Further Experiments:
Conclusion:As we can see, there is a tremendous amount of physics behind the beautiful color bands seen in soap films or oil slicks. Many factors come into play when determining the intensity of a given color at a specific point in the soap film. Through the use of a spreadsheet, I was able to calculate the relative intensities as a function of thickness and wavelength. The plots enabled me to explain the 'black band' phenomenon, as well as the existence of a 'white band' immediately below the black band. The validity of my work could be verified by comparing my plots to those in a published paper written by Paul Huiber and Dinesh Shah. The intensity versus wavelength plots of both reports match up precisely for equal thickness values. In my research I have delved into many different realms of physics, consolidating my results with existing knowledge to create a focused and structured report that I hope others will enjoy. With the help and patience of Dr. Noé, I have acquired a variety of skills and knowledge that will be passed on to my students during my teaching career. ReferencesWebsites:
Literature:
|