Introduction
If a coherent beam of light is scattered from some object then the wave front of the scattered light is charteristic of the topography of the object. However ordinary cameras can only record the intensity of this wavefront so the phase information is lost and the resulting in a is only two dimensional. In the October 16, 2000 Physical Review Letters K. Buse and M. Luennemann explain how to use a rotatable thin birefringent crystal and two polarizers to capture the whole three-dimensinal wave front.Theory
The method described by Buse and Luennemann is based on using the birefringent crystal to interfeare the parallel and perpendicular polarizations of the light. The wavefront first passes through a polarizer oriented at angle of 45 degrees to the optical axis of the crystal. The light then passes through the crystal followed by another polarizer oriented 90 degrees to the first. After passing through the second polarizer the image is recorded by a CCD camera (charge-coupled device). The phase information is obtained from the diffrences in the images at different orientations of the crystal.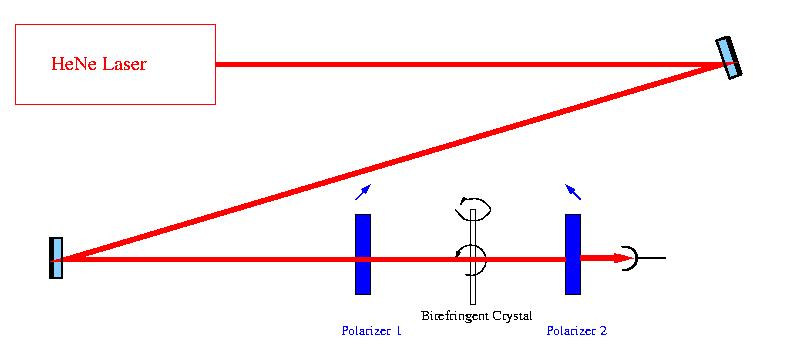
A biregringent crystal effectivly has at least two different indicies of refraction. So light is split into two components that travel with different phase velocities. At end of the crystal the waves recombine with resulting in a new direction of polarization. The polarization of the wave after the crystal is based on how far the wave travled inside the crystal. However the path length inside the crystal is determined by the angle of the incident beam. For a curved wave front, different parts of the wave front make different incident angles with the crystal. So after the crystal the polarization becomes spatially modulated depending on the shape of the incoming wavefront. The second polarizer allows the polarization pattern to be converted into intensity information then can be recorded by the CCD camera.

The crystal in this apperatus should be mounted to rotate in both directions out of the plane. One reason for rotatation is to distiguish between loacal sections of the wavefront that have the same incidnet angle but different directions. The rotations also allow for mutiple measurments thus reducing the effects of inhogenity of the itensity distribution. Since the polarization is effected by the orientation of the crytal a calibration curve is needed. The transmitted intensity as a function of angle is measured. Then the derviative of intensity with respect to angle divided by the intensity is plotted against the angle of incidence. The object is then placed in the beam before the first polarizer. Two images are taken with the crystal at slightly different angles. Next the diffrence of intensity divided by the difference in angle divided by the inensity of one orientaition is calculated.
![]()
This can be compared to the calibration curve to find the angle of propagation of the local wave front. A two-dimensional integration finally yields the wave front profile.
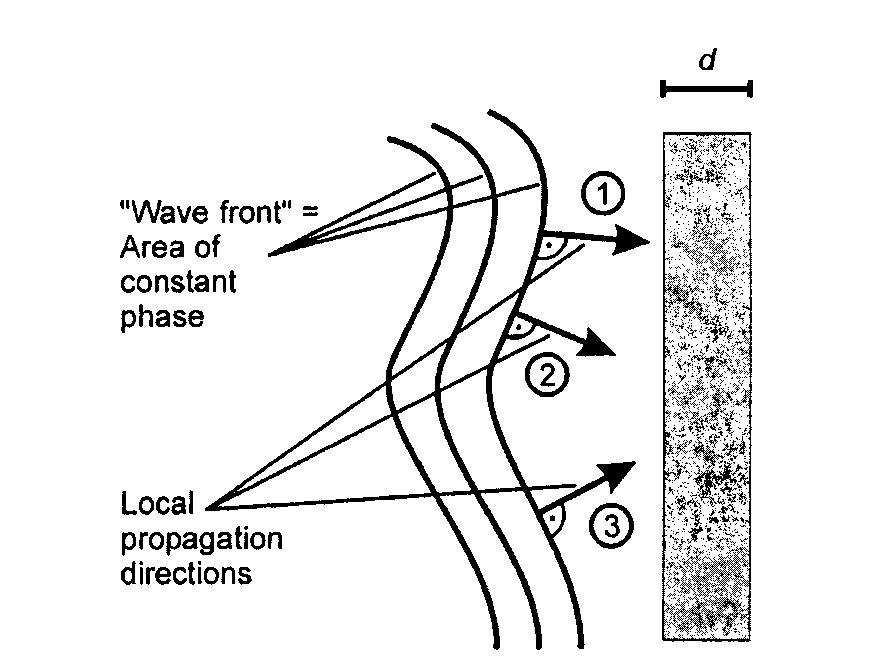
Figure from K. Buse and M. Luennemann PRL 16 OCT 2000
Experiment
The transmitted intensity was measured as a function of angle for the crystal rotated about the x-axis to an angle of ??? degrees. This angle was necsary because when perpendicular the crystal did not have enough birefringence. This could be because the optical axis of the crystal was not what we thought it was. When the crystal was rotated about the y axis with no angle about the the axis there was not enough difference between the intensities for the different angles. In other words the crystal could not be rotated far enough to see any difference in the intensity.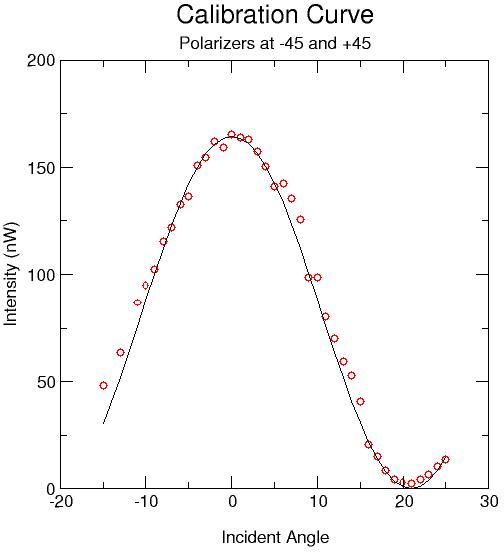
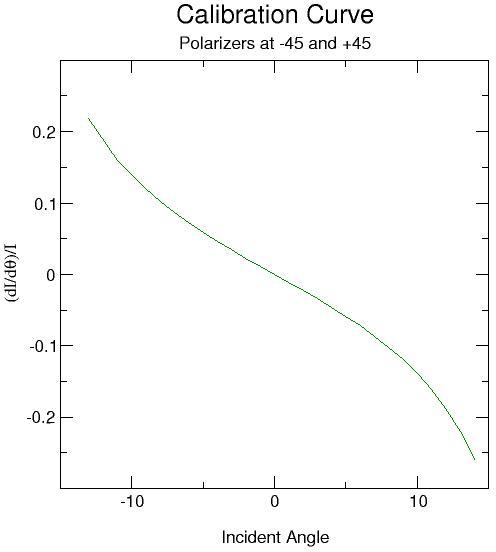
This was fitted with a cosine squared function. Next a derivative of the fit was taken and divided by each intensity to produce the calibartion curve below.
The object that I used was a small glass rod the was heated up and formed into a ring. The camera was postioned in the beam to obtain the image of the ring shown below.
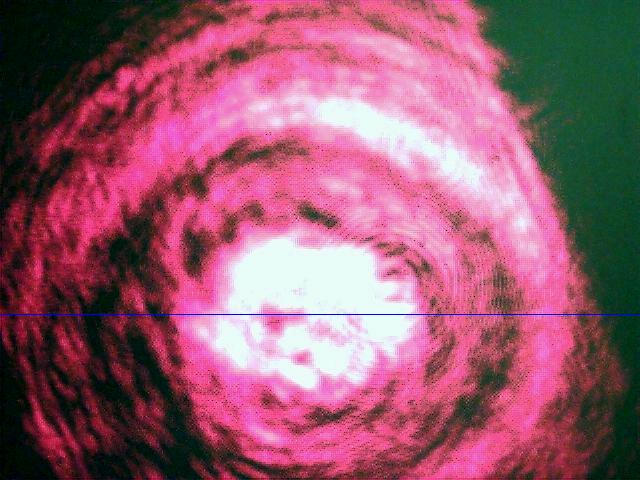
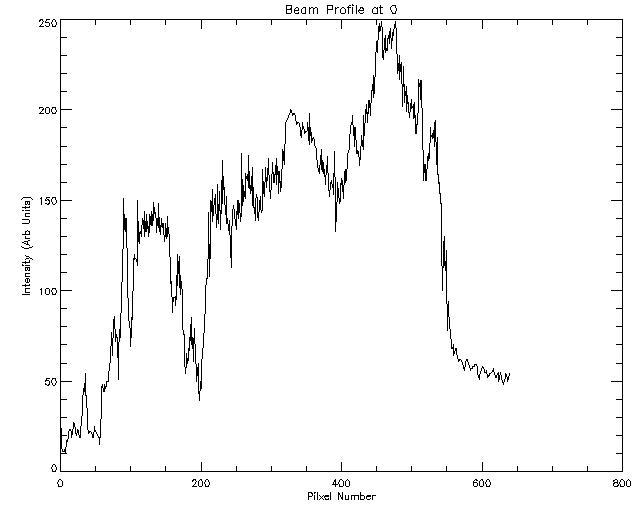
The images at various angles where imported into IDL for analysis. The graph below is the beam profile along the blue line in the picture above at 0 degrees incidence angle.
Then the difference between the image at 0 degrees and the imafe at 2 degrres was divided by the intensity of the image at 0 degrees and the diffrence in the angle (in this case 2 degrees). This is shown below for the points along the blue line.
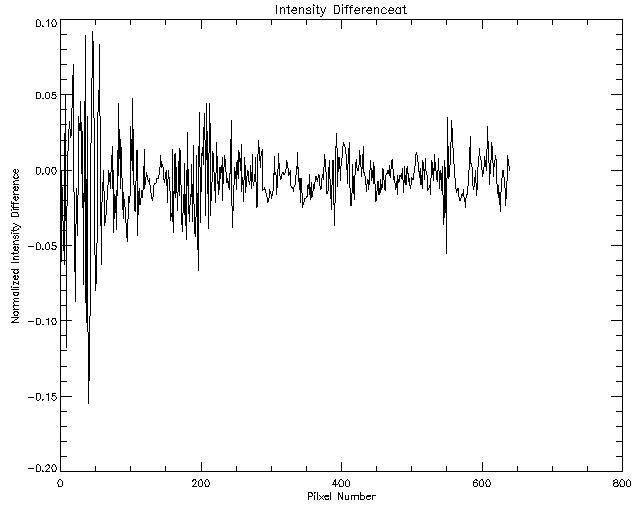
This is not very conclusive. Two things could improve the results. A better object and a better crystal. Also using a CCD may help provide a better measure of the relative intensity of each pixel in the image.