Observing Resonant Cavity
Modes in Helium-Neon Lasers
Casey McKenna and Nicholas Sardelli, with John Noé
Laser Teaching Center
Stony Brook University
Introduction
Dr. Noe ignited our interest in lasers upon our first meeting with him in the Laser Teaching Center (LTC). We always found lasers interesting, but like most of the general public, we did not understand how they really work. Dr. Noe taught us about the structure of a laser as well as the processes that go on inside the optical cavity, such as pumping, spontaneous emission and stimulated emission. There are so many different approaches one could take when exploring the functions of a laser that it was difficult for us to choose what to base our project on. Eventually it became clear that we should start with the basics and learn how a laser can be described as a resonant system. This was a great starting point because we were familiar with standing waves but we had never applied them in this context. The fact that this could be applied to not only sound waves but also electromagnetic waves intrigued us. It must have been the observation of transverse modes that we were able to form by placing a hair in the open cavity laser that sealed the deal: we wanted to investigate the behaviour of modes in various laser cavities in order to understand how they operate on the fundamental level.
The goal of our project was to learn about transverse as well as longitudinal
modes inside the cavity of a laser and how to explain the process of lasing through
the lens of describing the laser as a resonant cavity. Transverse modes can be
described as the spatial pattern seen on a screen of the cross sectional profile of
the laser beam. Longitudinal Modes can be described as the frequencies of light that
can fit inside the cavity by an integer number of half wavelengths. We knew that the
standing waves that can be supported in a cavity are dependent on the length of the
cavity so we tested lasers of a few different cavity lengths by focusing the output
onto a photodetector connected to an oscilloscope as well as a spectrum analyzer.
The type of lasers that we tested were all helium-neon (HeNe) gas lasers. We ended
up making interesting discoveries about the nature of such a resonant system and how
the laser modes interact with each other.
What is a Laser?
The first step in our quest to learn more about HeNe lasers was to first
understand how a laser actually functions.
Image from Sam's Laser FAQ
The above image is a HeNe laser diagram. First there is the laser cavity, which
is the space between the two reflectors (HR and OC in diagram). Conveniently placed
in between the mirrors is a glass tube. This glass is there to hold helium and neon
gases in a controlled place. Furthermore, the helium and neon gas in the cavity is
called the gain medium. The gain medium is the substance that creates laser light. A
cathode and anode are attached to the left and right sides, respectively. The anode
and the cathode are there to put an electrical current through the gain medium. The
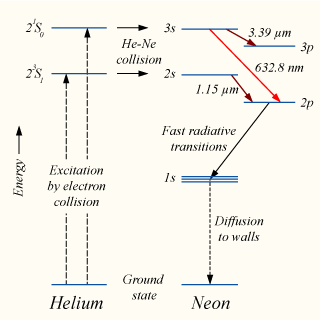
helium atoms in the medium are excited by the electric current, and become excited.
The helium atoms then collide with the neon atoms. This collision then transfers the
excitation from the helium atoms to the neon atoms. Now that most of the atoms in
the medium are excited, a population inversion has been created (more excited atoms
than ground state atoms). A population inversion is necessary to produce continuous
laser light emission. The neon atoms then will drop down to one of several energy
levels (see emission excitation diagram), and emit coherent photons as a result of
dropping in energy level. More energy is then supplied by the cathode and the anode,
and the process continues. The process of an excited atom dropping in energy level
and emitting a photon is known as stimulated emission.
There is a high reflecting mirror on each side of the cavity. The mirror on the back (left side of
diagram) is nearly 100% reflective. The mirror on the front (right side of diagram) is slightly less
than 100% reflective (typically 99%). These mirrors allow for laser light to continuously reflect within
the cavity, while allowing a small percentage of it to escape out of the less reflective mirror. The
light emitted by stimulated emission of neon atoms must be emitted in such a way that the light reflects
off of both mirrors and continuously reflects off of them. With each pass of the light reflecting in the
cavity, the light becomes amplified by a process of superposition of light waves. In the end, some of
the light passes through the less reflective mirror, and since the light is coherent, a dot of light can
be observed when shining the laser on an object. All of these processes together have given rise to the
acronym LASER (Light Amplification by Stimulated Emission of Radiation).
Transverse Modes
Learning that a laser could be described as a resonant cavity was surprising at first, but looking back
on it now we cant believe that we didnt see it before. The light in the laser cavity is a wave that is
restricted at both ends by two highly reflecting mirrors, so the amplitude of the wave at these ends is
zero and the light wave reflects back on itself inverted... like a standing wave on a string held at
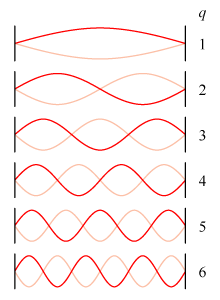
both ends! Obviously this means that for a laser of a fixed length (we will see later why this is not
entirely realistic) only certain integer numbers of half wavelengths, or modes, will be sustainable
under such conditions. These will be the wavelengths, and thus frequencies, that will be amplified by
the laser as they reflect back and forth across the gain medium. Our first goal was to create transverse modes
in an open cavity laser. The one we have is similar to the one (from Sam's Laser FAQ) shown here and has
been used by several previous LTC students, including David Meltzer, Justian Tian, Vince Gregoric and Alex
Ellis.
The simplest transverse mode has a Gaussian intensity profile. Transverse modes
can be created by putting a thin obstacle in the lasing path (such as a hair), or by
slightly changing the orientation of the output coupler mirror. The mode on the left
is a 0-2 mode, and the mode on the right is a 0-3 mode, evident by the number of
dark fringes. These patterns can actually be modeled mathematically if one
multiplies the Gaussian function that represents the 0-0 mode by a Hermite
Polynomial.
Longitudinal Modes
Most of our project concerned longitudinal modes, that is, the spectrum of
discrete frequencies that the laser puts out. One can't observe these frequencies
directly with electronic instruments since they are in the range of hundreds of THz
(1014 Hz). But one can observe the interference or beat signals between
various modes using a fast photodetector. We used a DET-210 detector from Thorlabs
to observe the beat signals from two relatively long lasers, a Spectra-Physics Model
127 (88 cm cavity length) and a Melles-Griot Model 25-LHR-991-249 (44 cm). The
photodetector output was recorded in either a fast oscilloscope (Tektronix 485) or
an rf spectrum analyzer (HP 8566A).
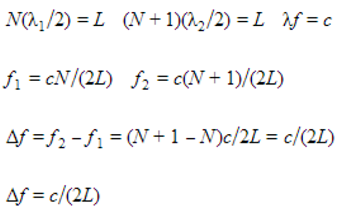
The diagram above illustrates some longitudinal modes in a laser's resonant optical cavity. In reality, there will be many hundreds of thousands of half-wavelengths within the cavity of a typical gas laser, not just three or six. The frequency difference between any two adjacent modes can be calculated from the mode number N (the number of half wavelengths in the cavity), the cavity length L, and the relationship between wavelength λ and the speed of light c:
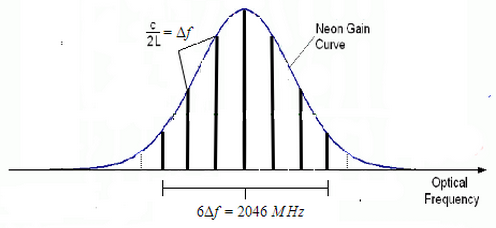
The modes that are amplified by the laser's resonant cavitiy are the ones that lie underneath the gain curve, which is dependent on the gain medium. In this case the characteristics of the gain curve determined by the neon gas comprising the medium within the cavity. Below is a diagram of the neon gain curve and a possible configuration of modes that could be amplified at any one time.
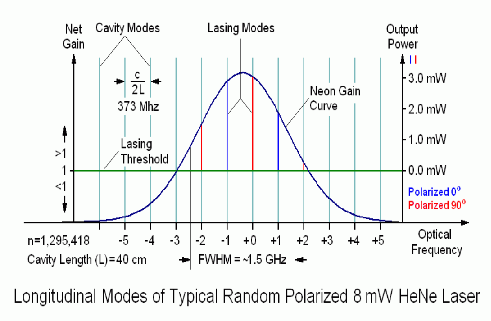
Image From Sam's Laser FAQ
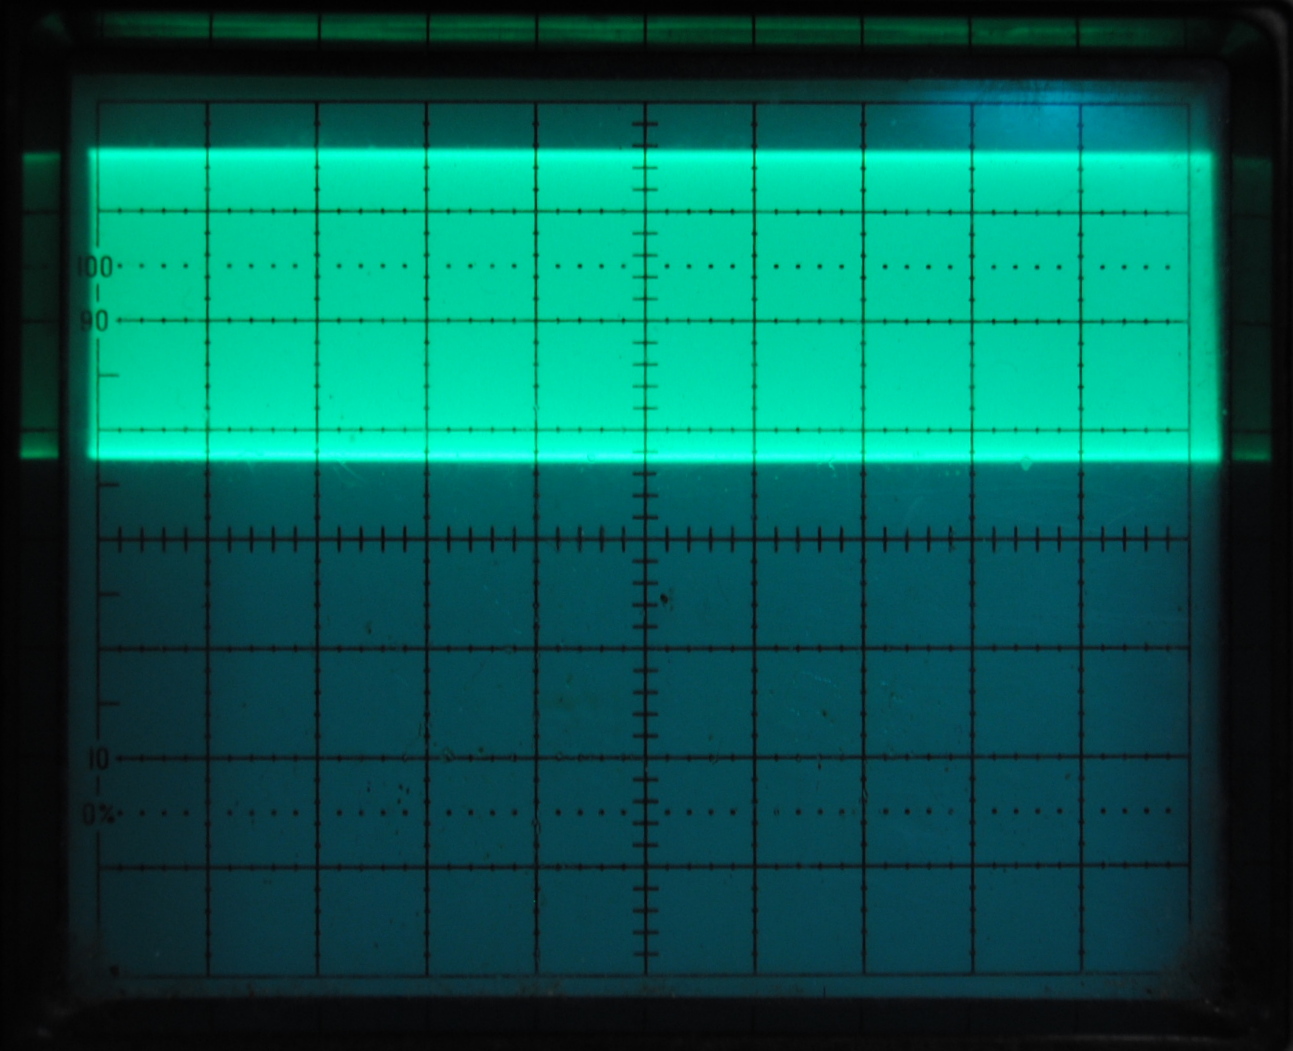
Mode beats in the 88 cm laser
We started by observing mode beats in the longest laser with the oscilloscope, which plots detector voltage (light intensity) versus time. The observed beat frequency of about 170 MHz (1.2 divisions at 5 ns/division) is in good agreement with the expected Δf for an 88 cm laser. The trace is non-sinusoidal because it is a complex combination of the beating of many modes.
If the modes can beat together to produce mode-beats, then what's stopping the
mode beats from beating with one another? As it turns out, they do in fact beat with
one another and produce what we call "beat of beats".

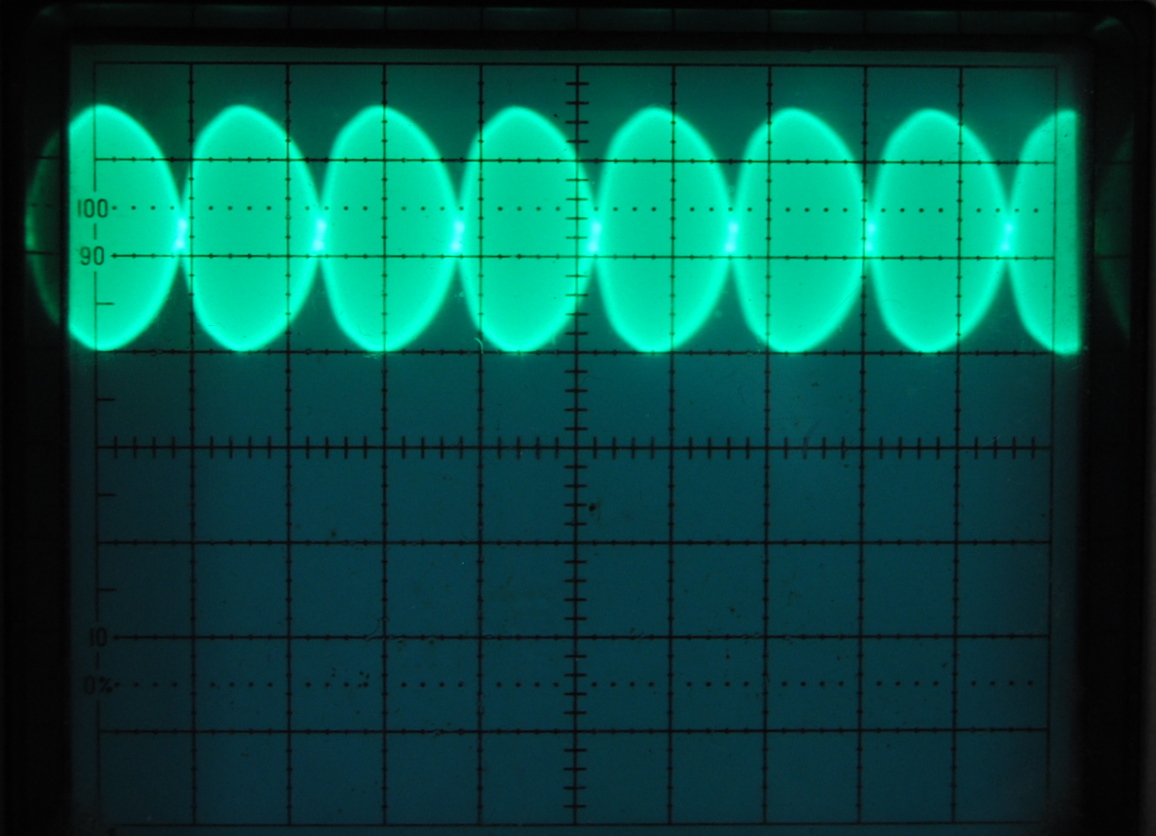
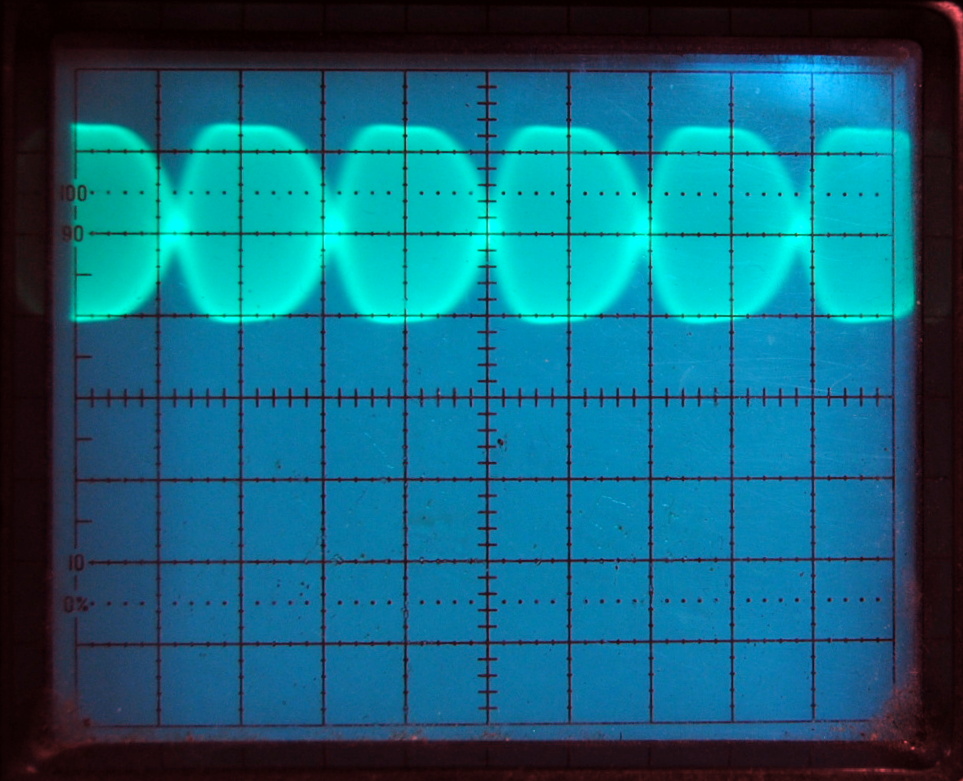
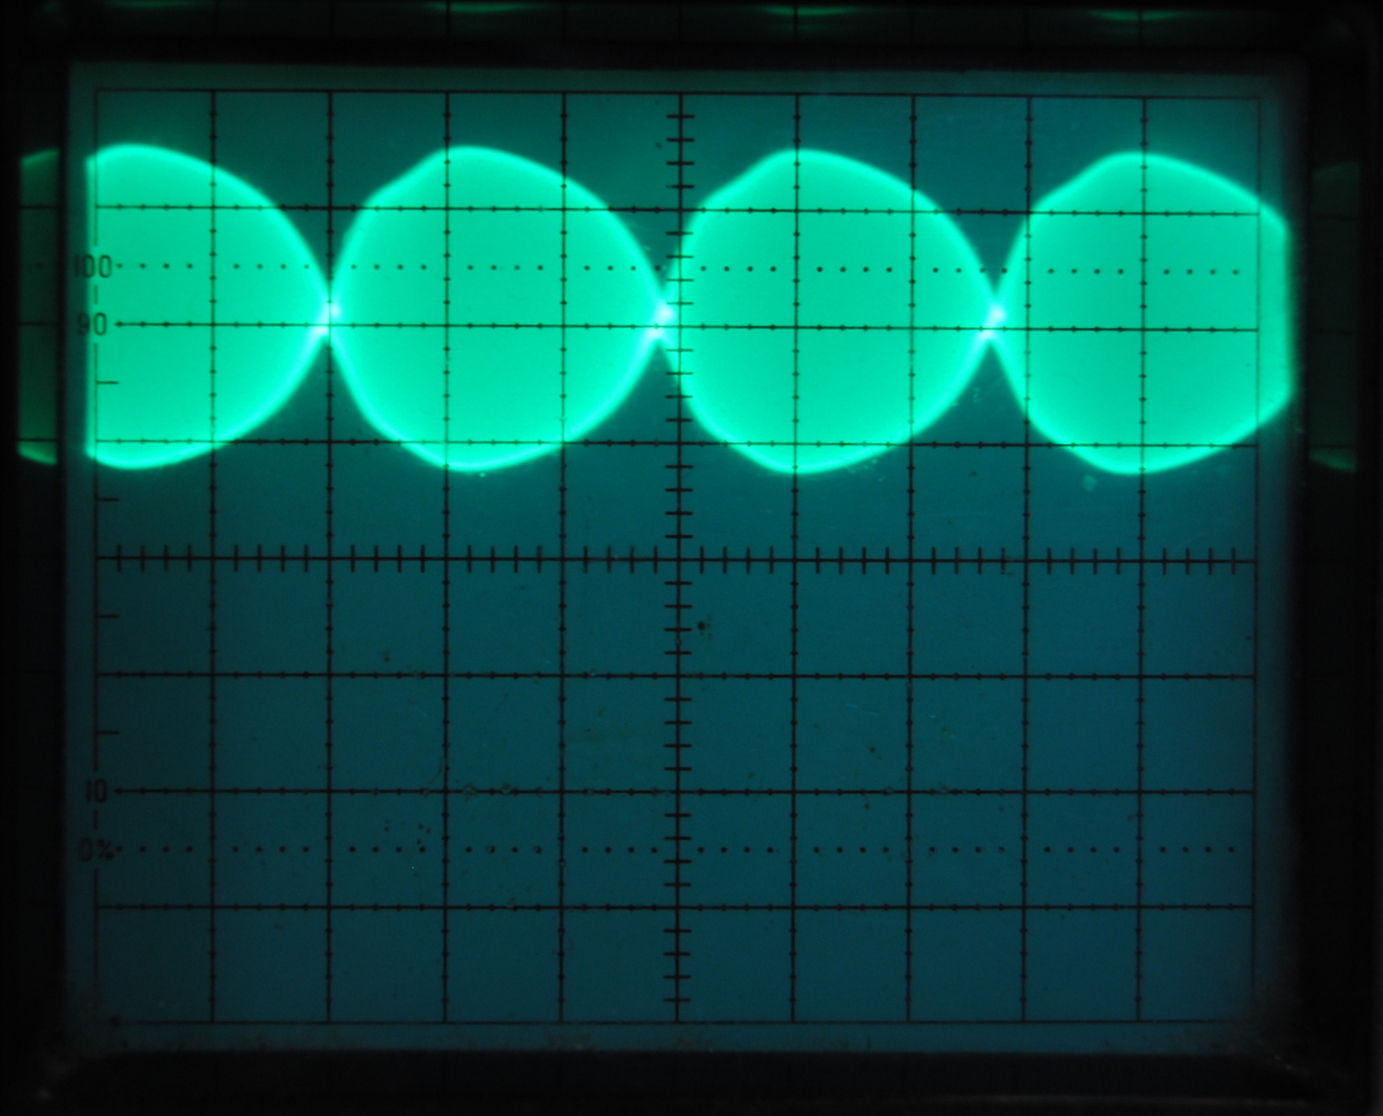

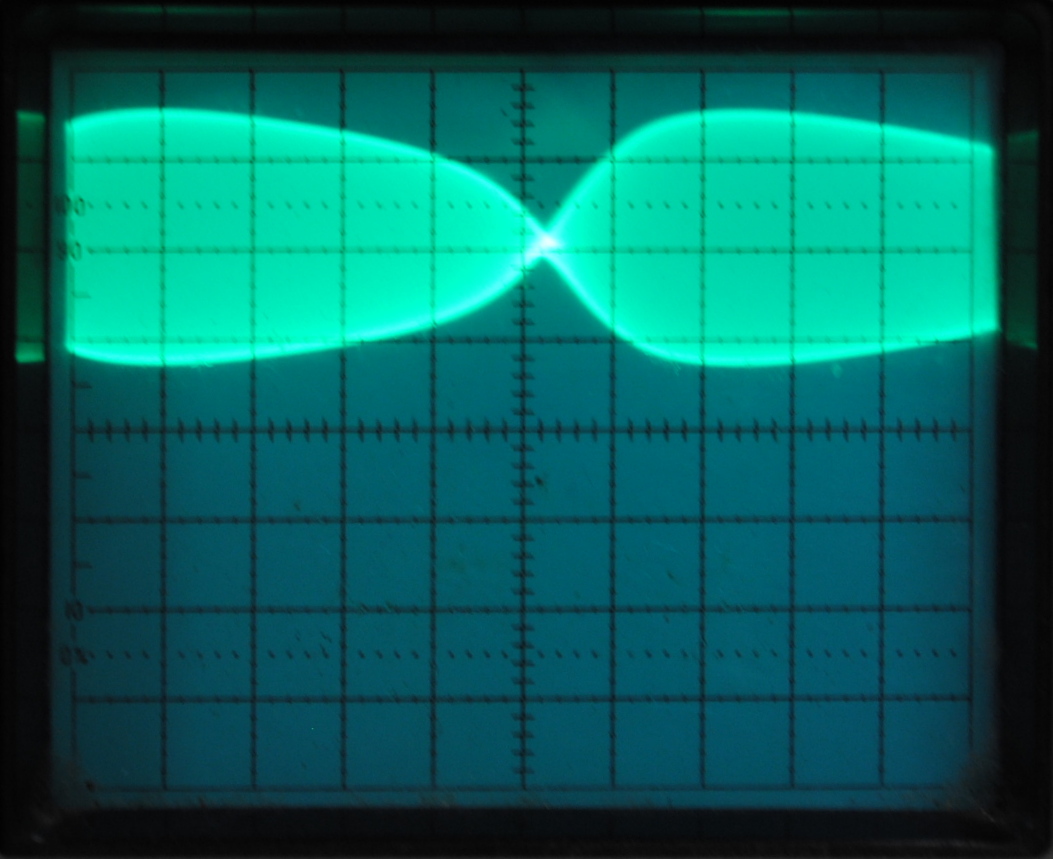

Click on an image to see a larger version.
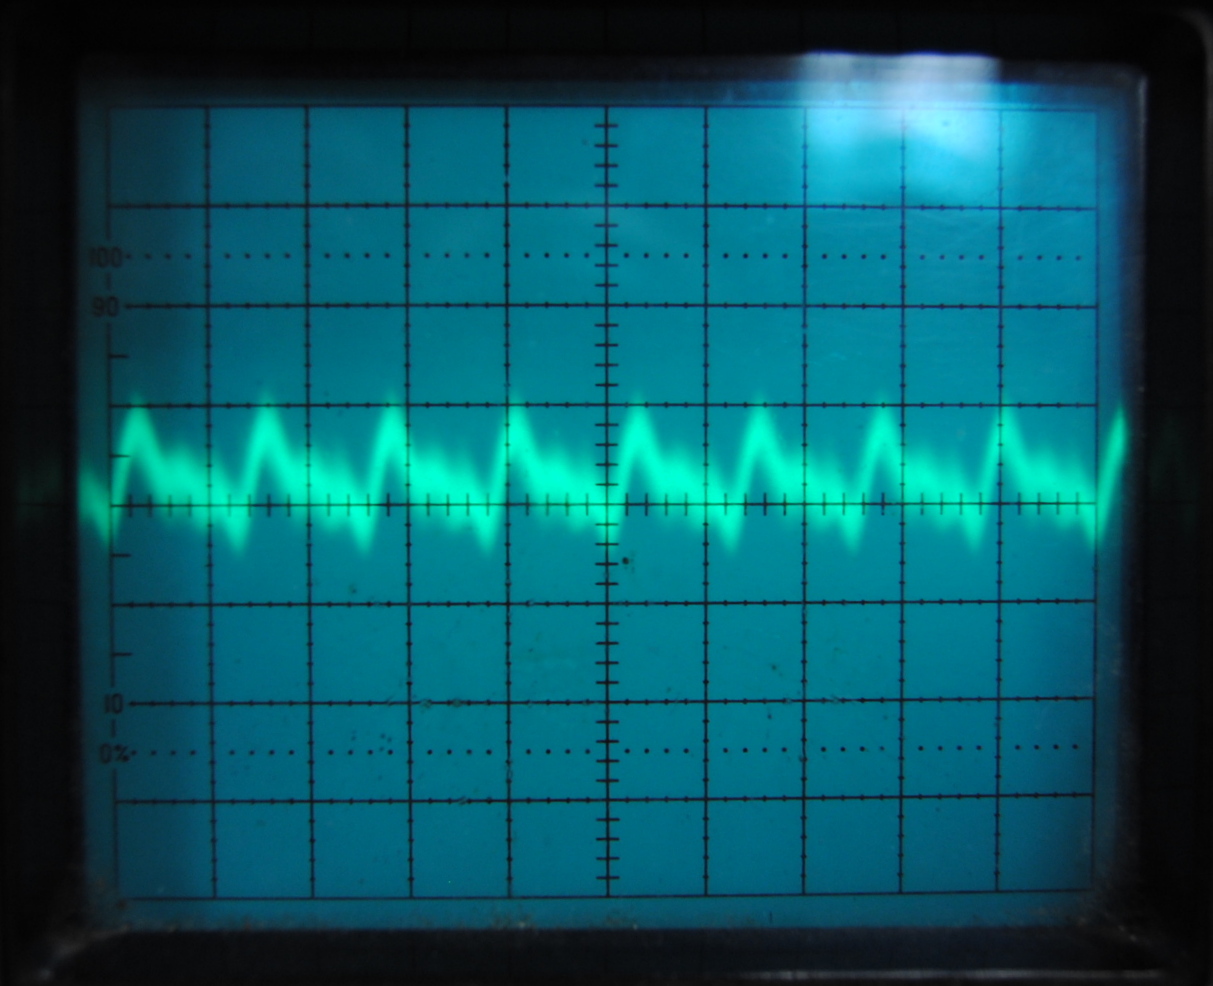
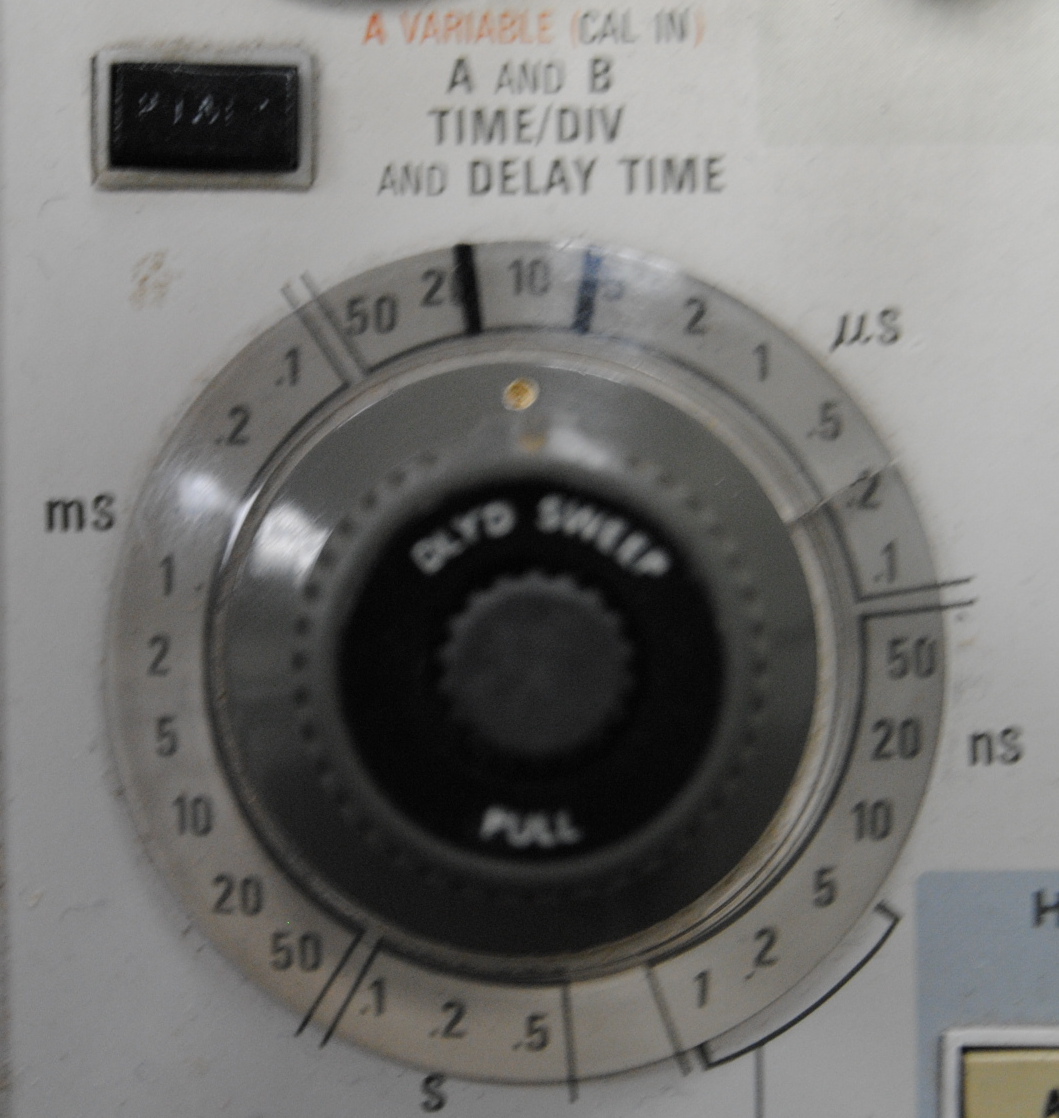
The first picture above represents the oscilloscope reading of one mode beat that is amplified by the 88 cm HeNe laser. By increasing the timescale per division to from 5 ns to 10 micro seconds we were able to observe the lower frequency mode beats. As can be seen above, we observed an interesting phenomena as the oscillations of the modes beats changed over time. The wavelength of this change decreased until the image became a straight line, oscillating between these two states. We speculated that the sinusoidal pattern reflected the complexity with which the mode beats beated with eachother, the "beat of beat" frequencies. In order to figure out what was causing the complexity of these oscillations to change we decided to look at the same data on a spectrum analyzer(HP 8566A).
Spectrum Analyzer Observations
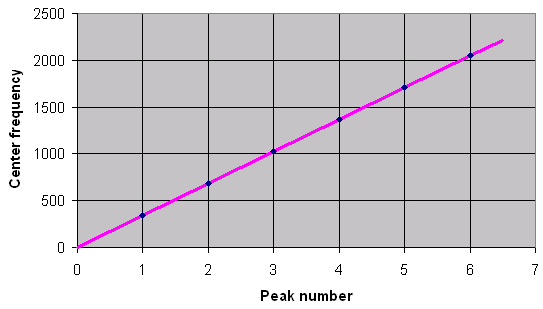
The spectrum analyzer records intensity in dB versus frequency. The image below shows the six beat frequencies of gradually diminishing intensity that we observed with the 44 cm laser. The six frequencies are integer multiples of the lowest frequency, as illustrated in the plot.

The sketch below shows why there are six peaks. While the lowest beat frequency corresponds to adjacent modes,
other pairs of modes can also interact. The highest beat frequency is the beat between the highest and lowest modes
amplified by the laser. The maximum beat frequency we observed is consistent with the typical HeNe gain curve width
(FWHM) of 1500 - 1700 MHz. As shown in the figure six beat frequencies corresponds to seven supported modes.
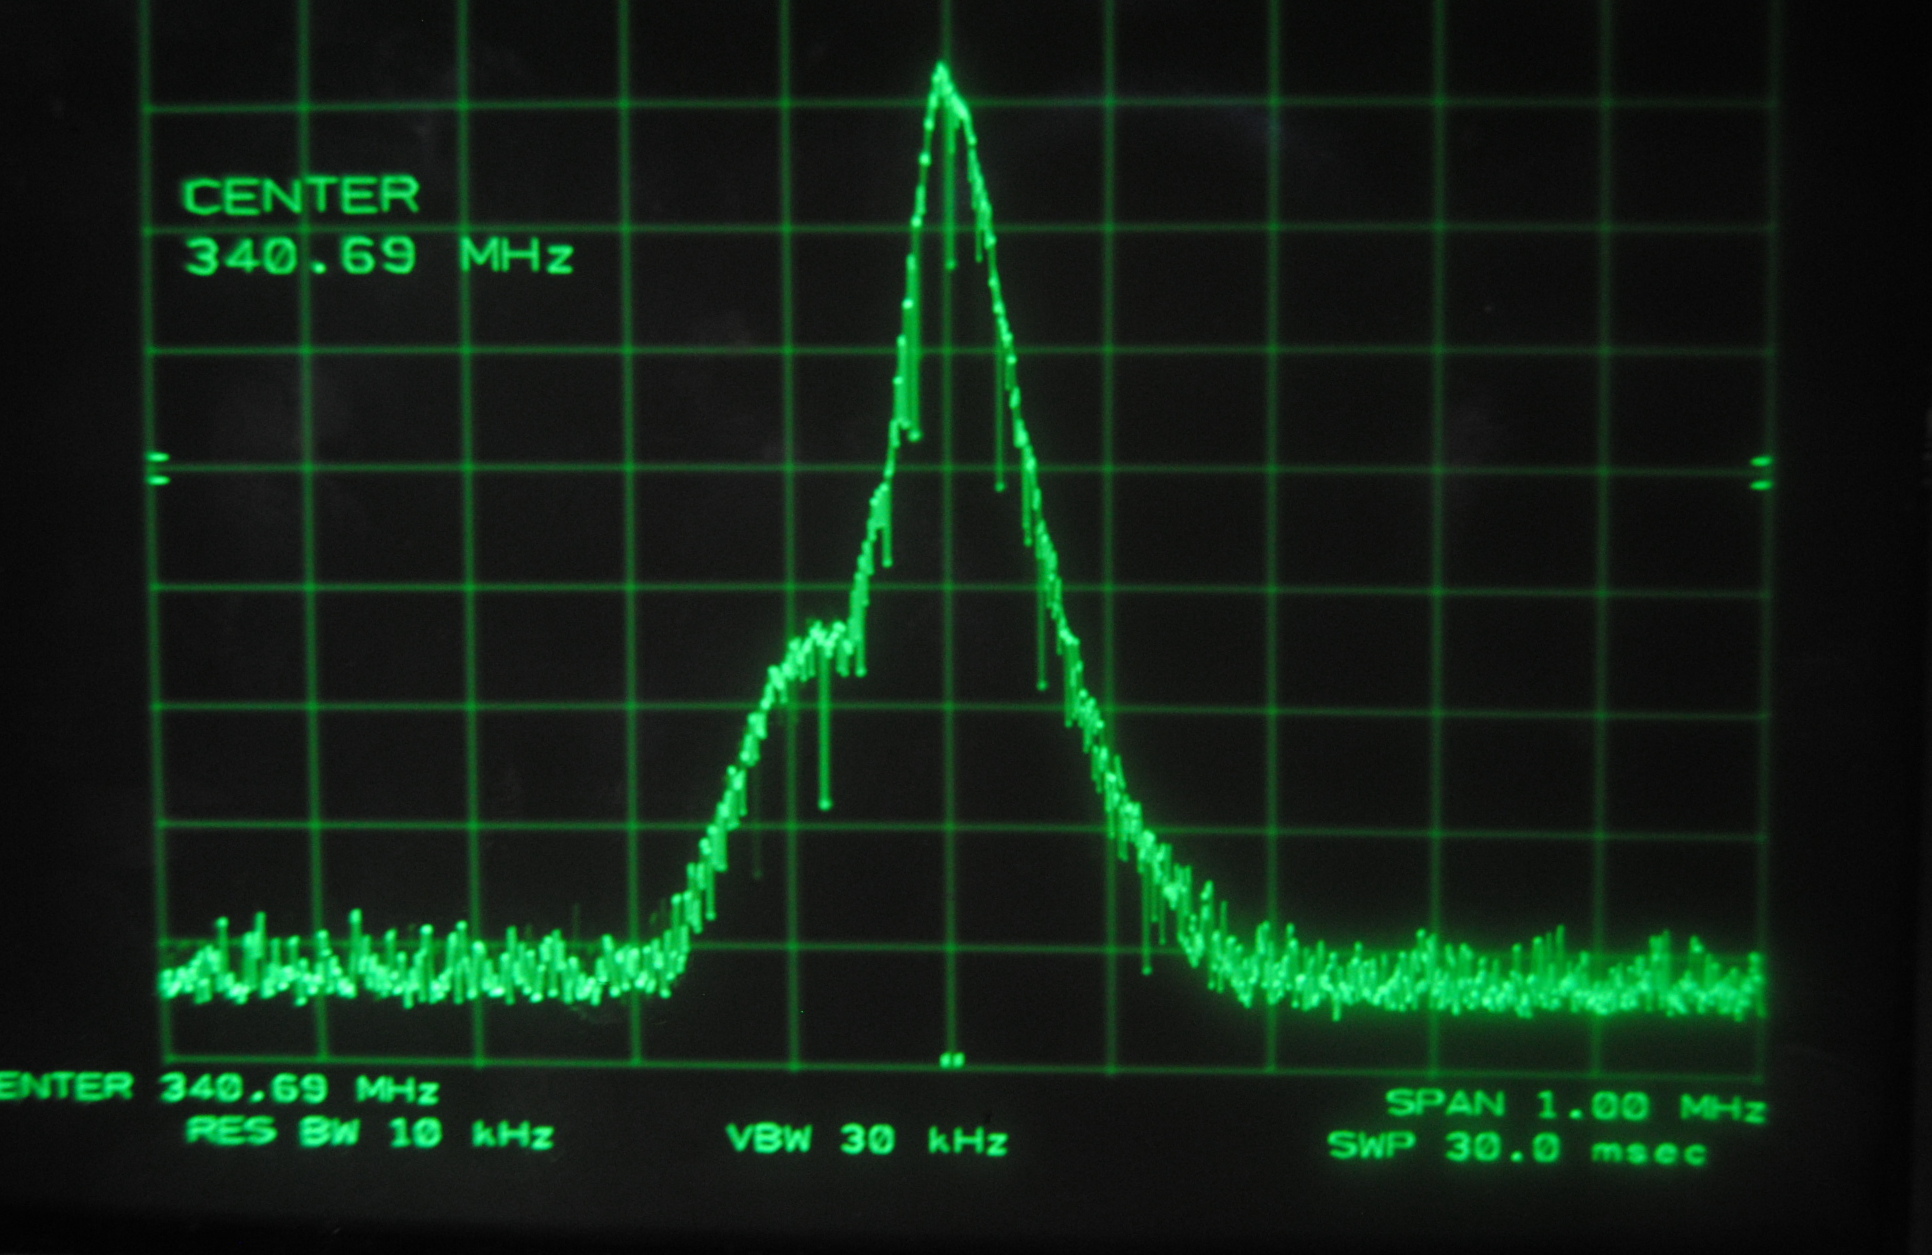


Above images centered at 341.69 MHz
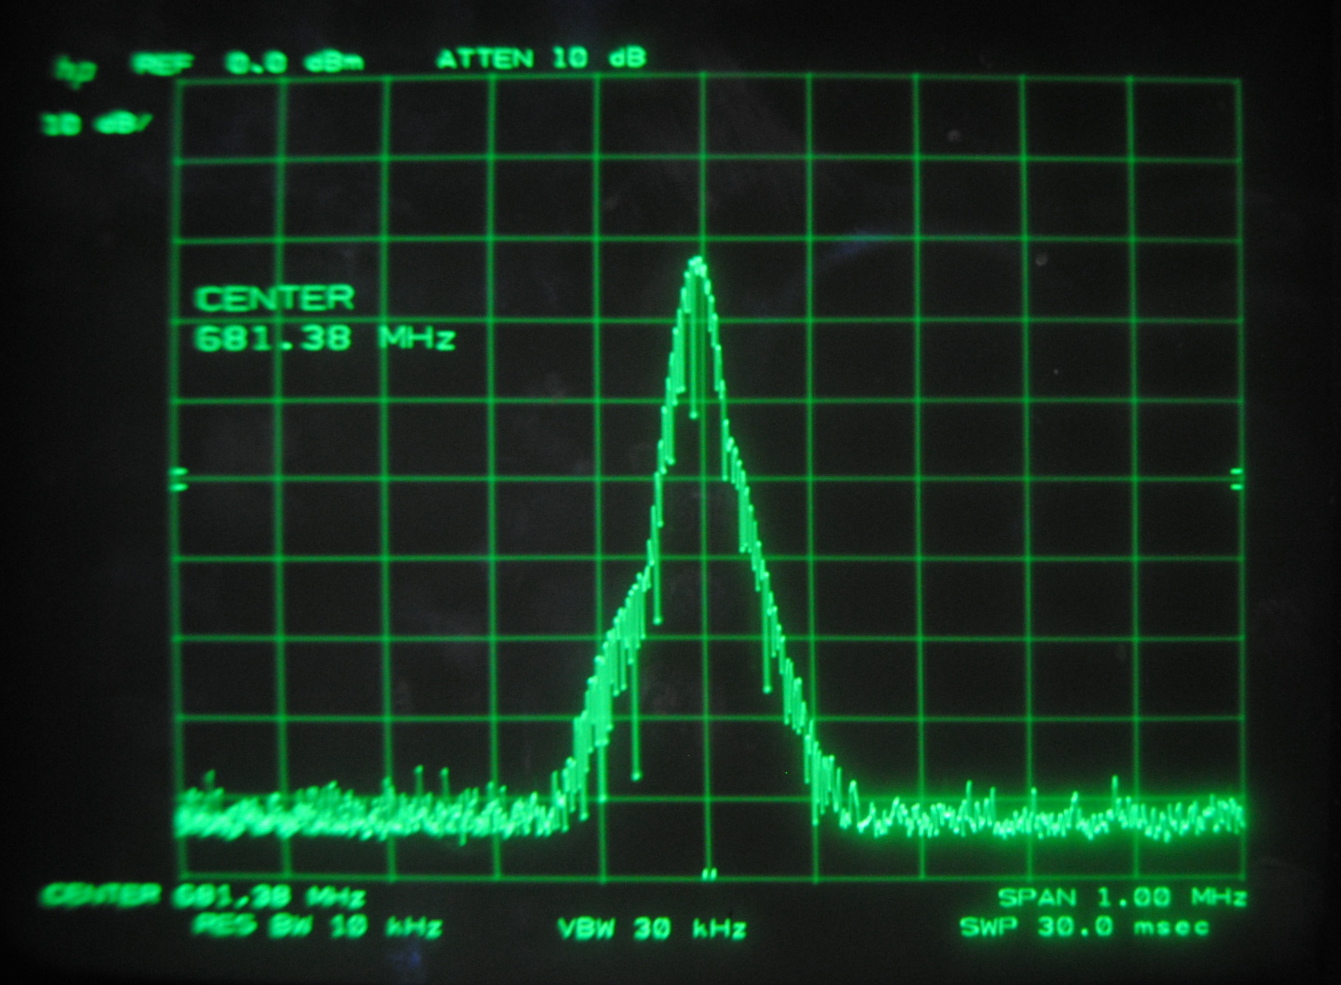
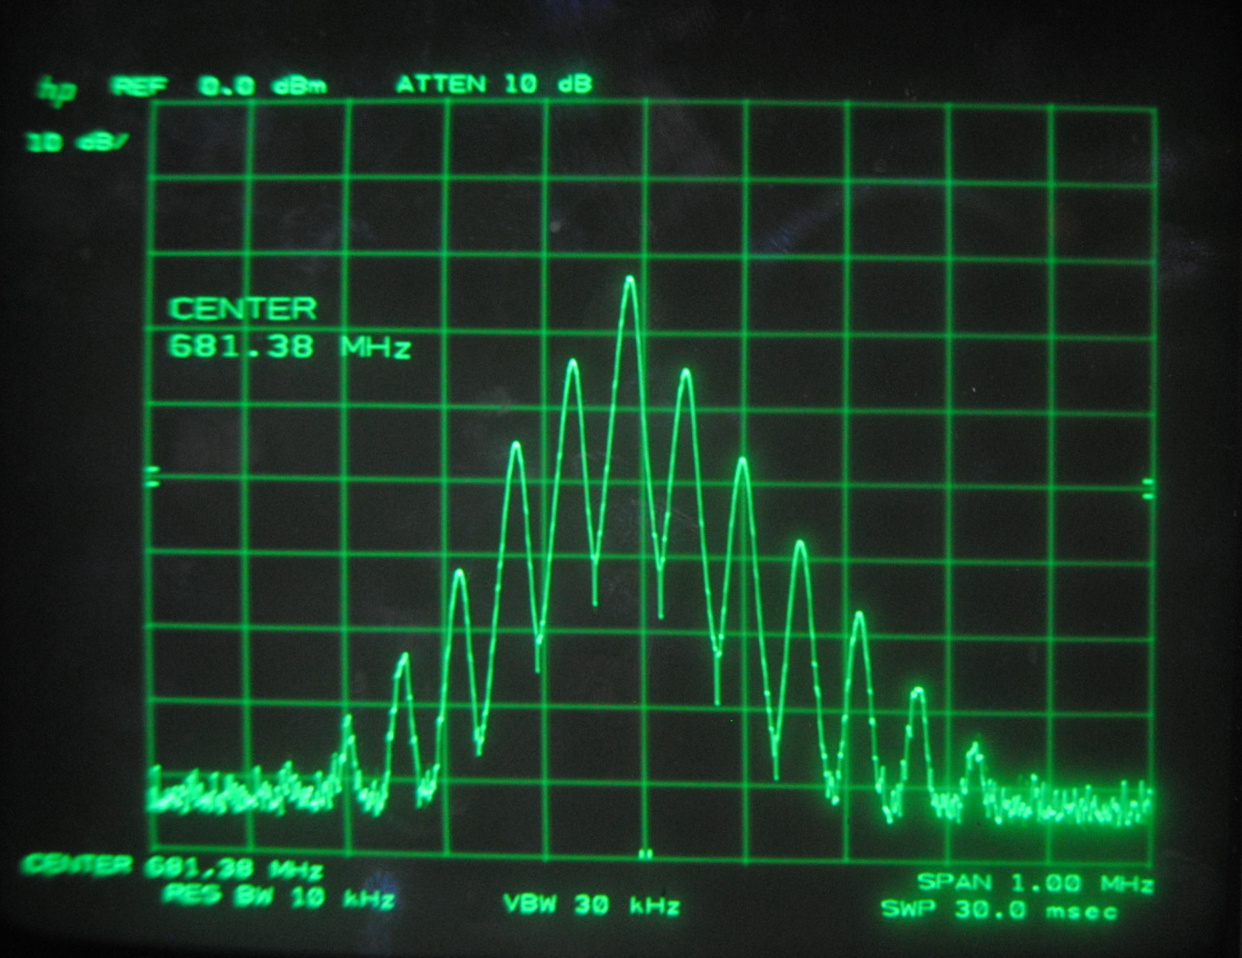
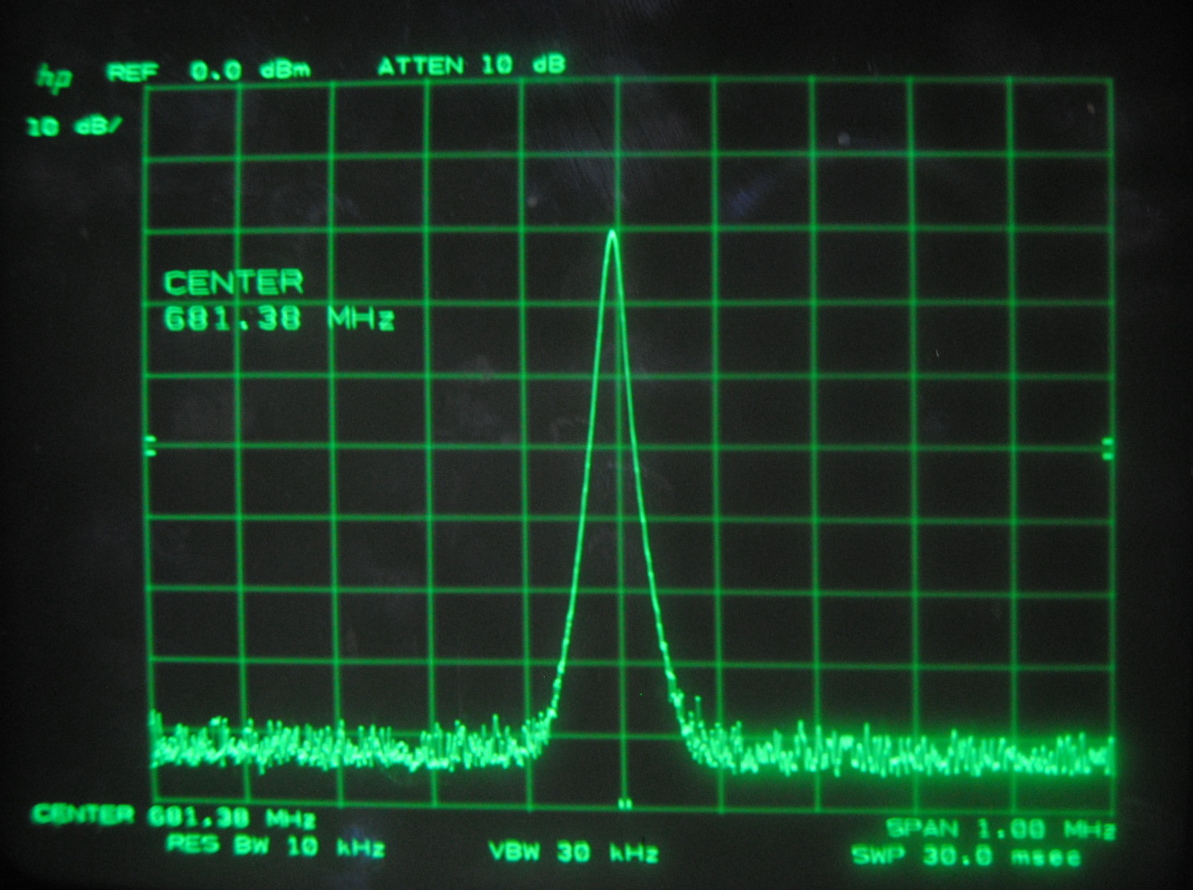
Above images centered at 681.38 MHz
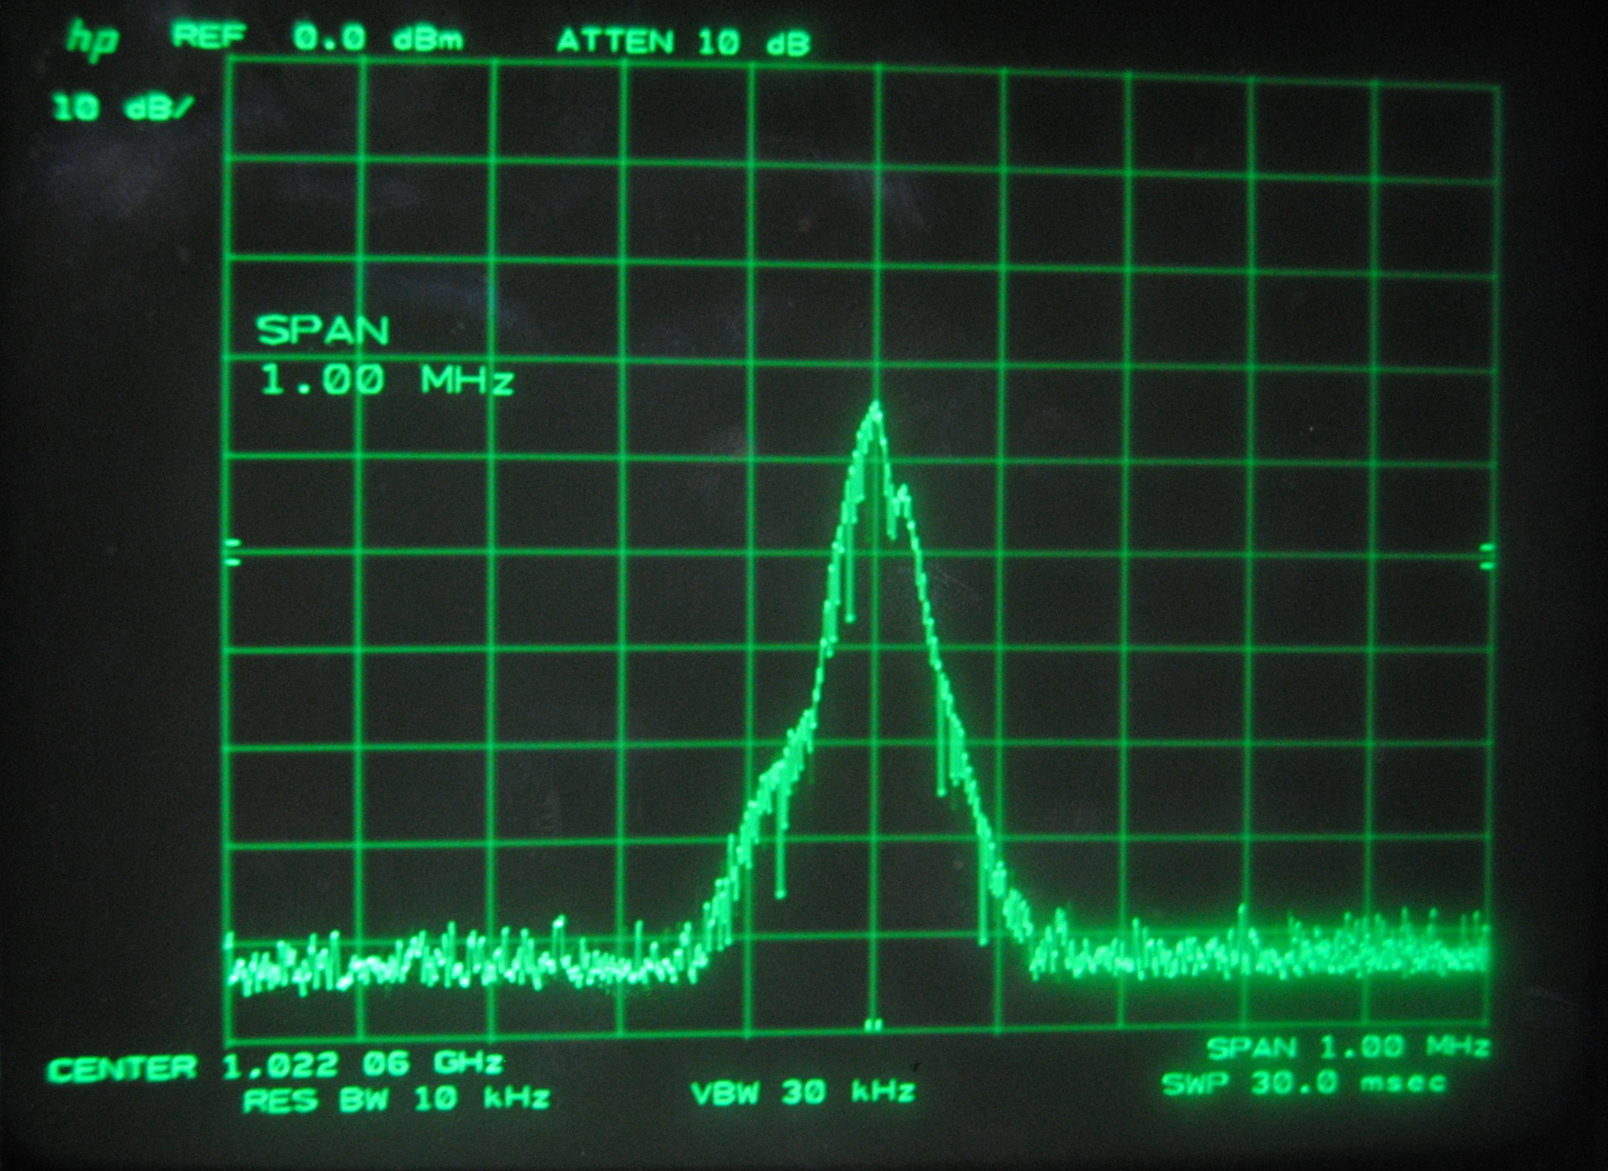
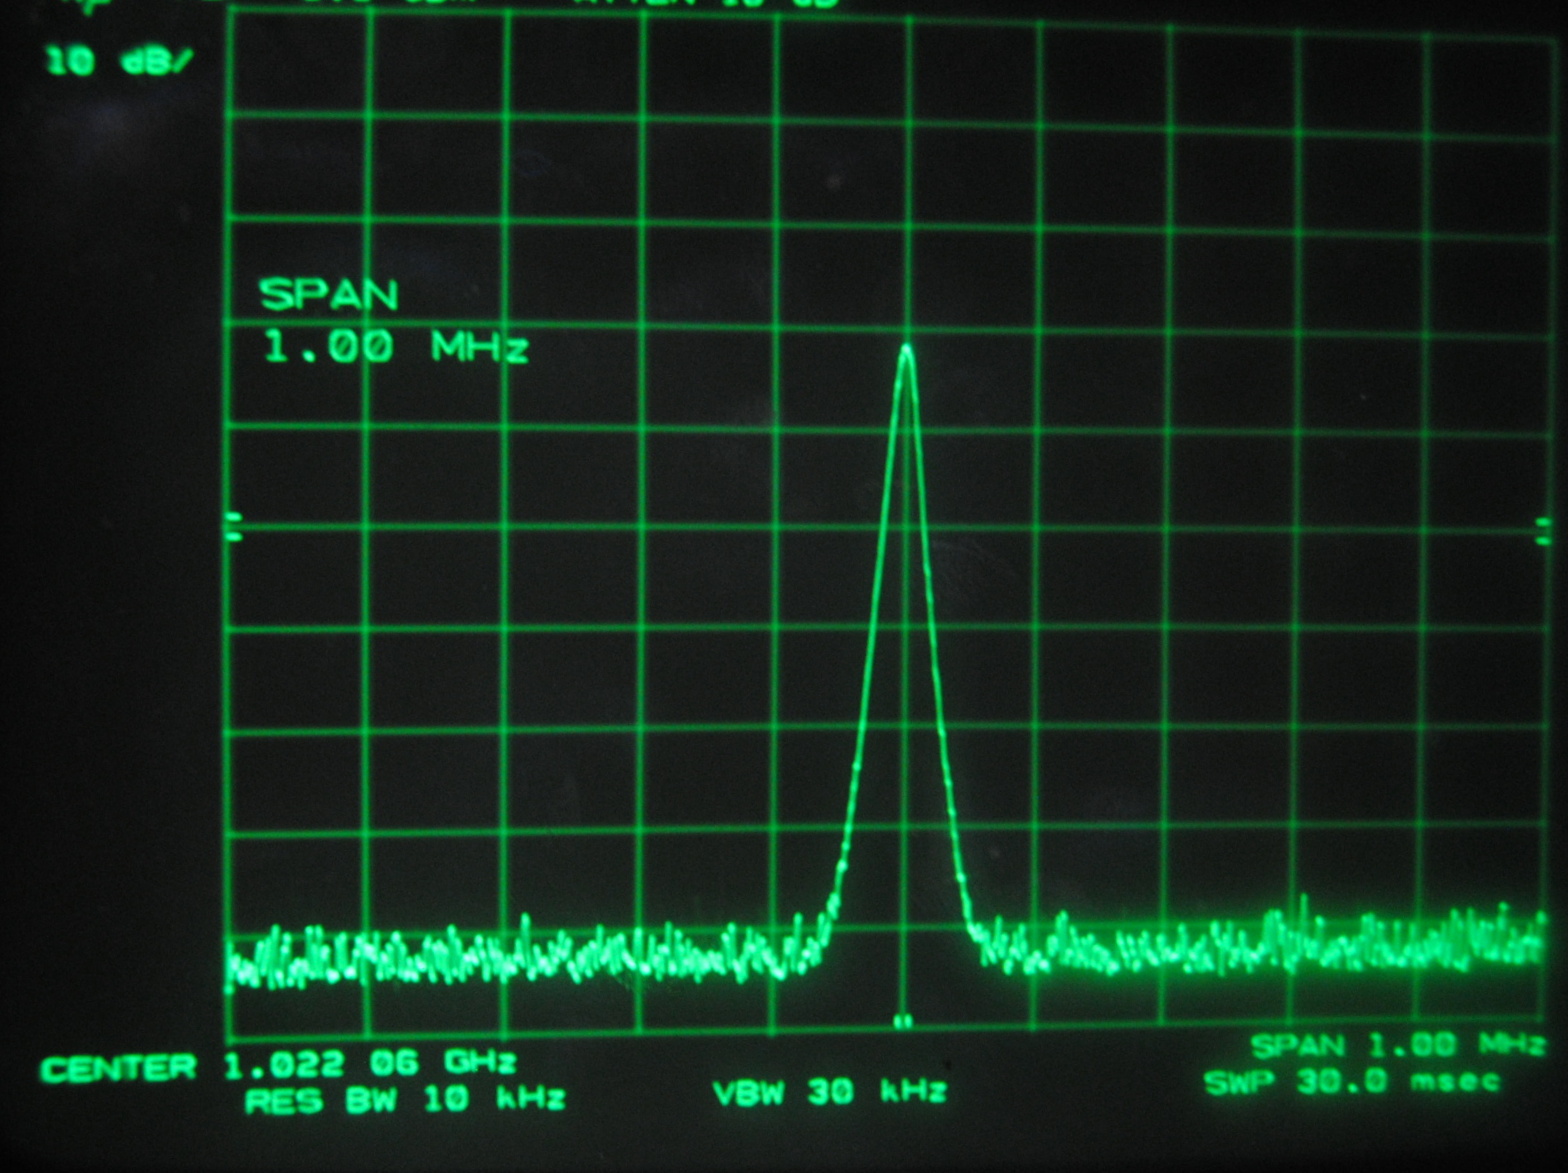
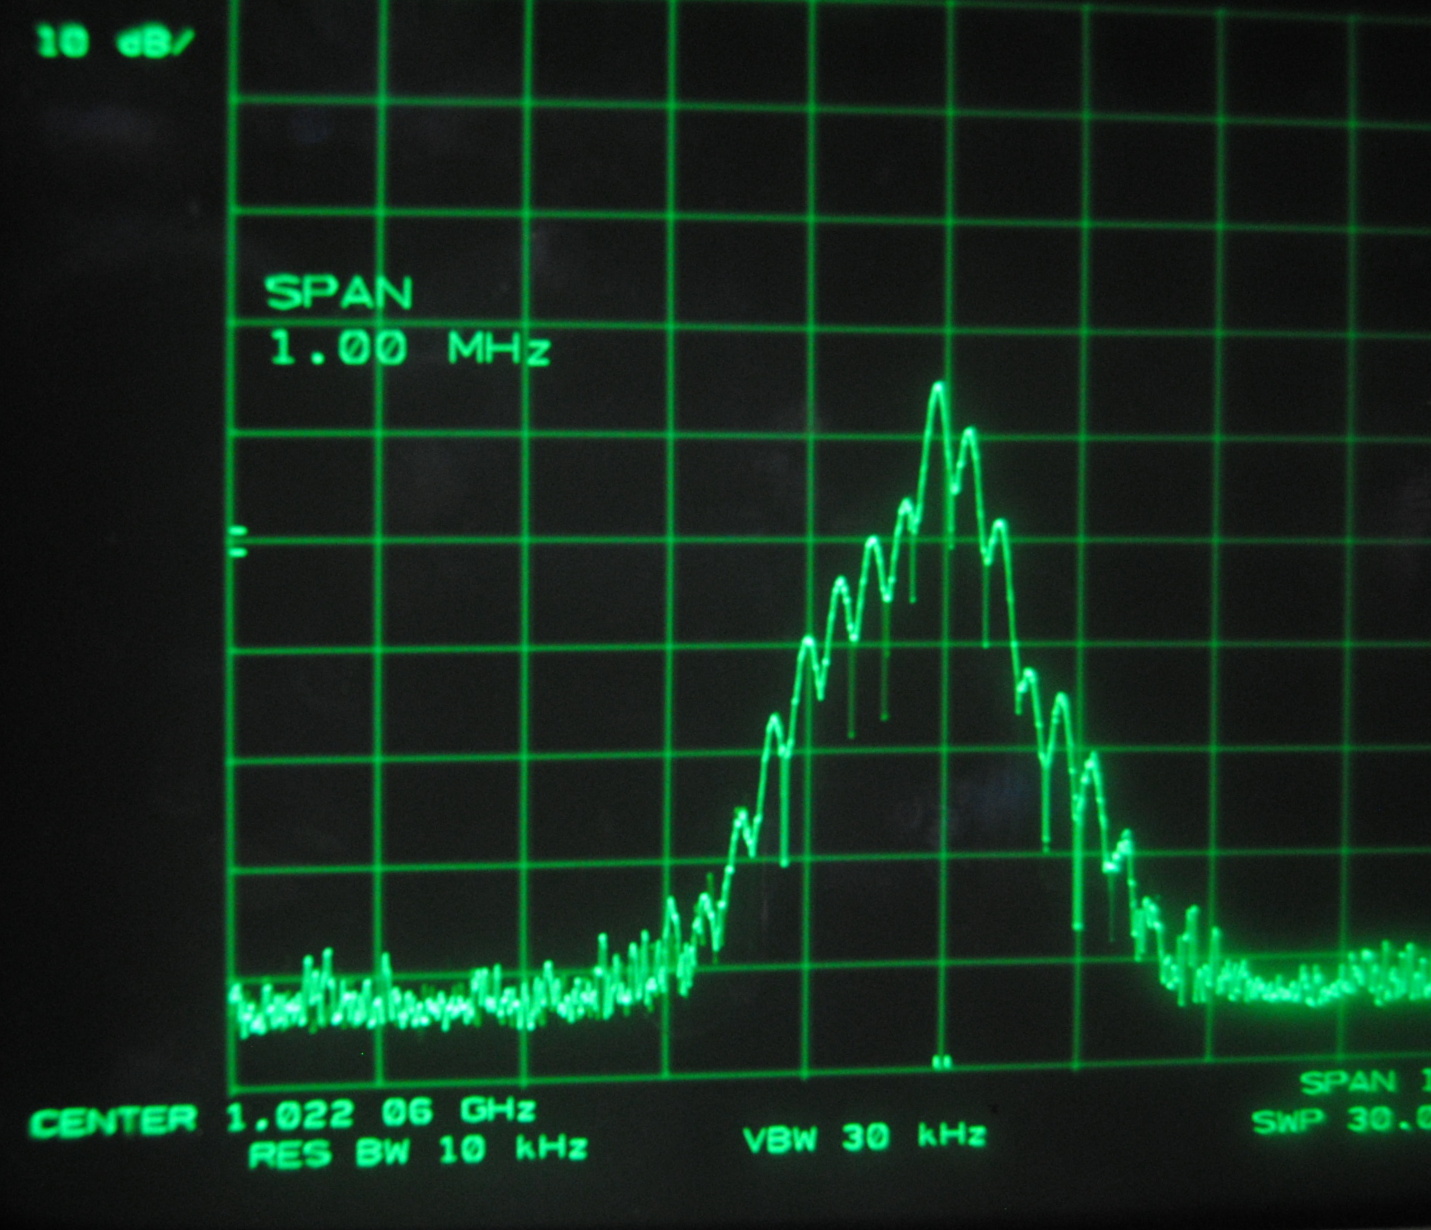
Above images centered at 1.022 GHz
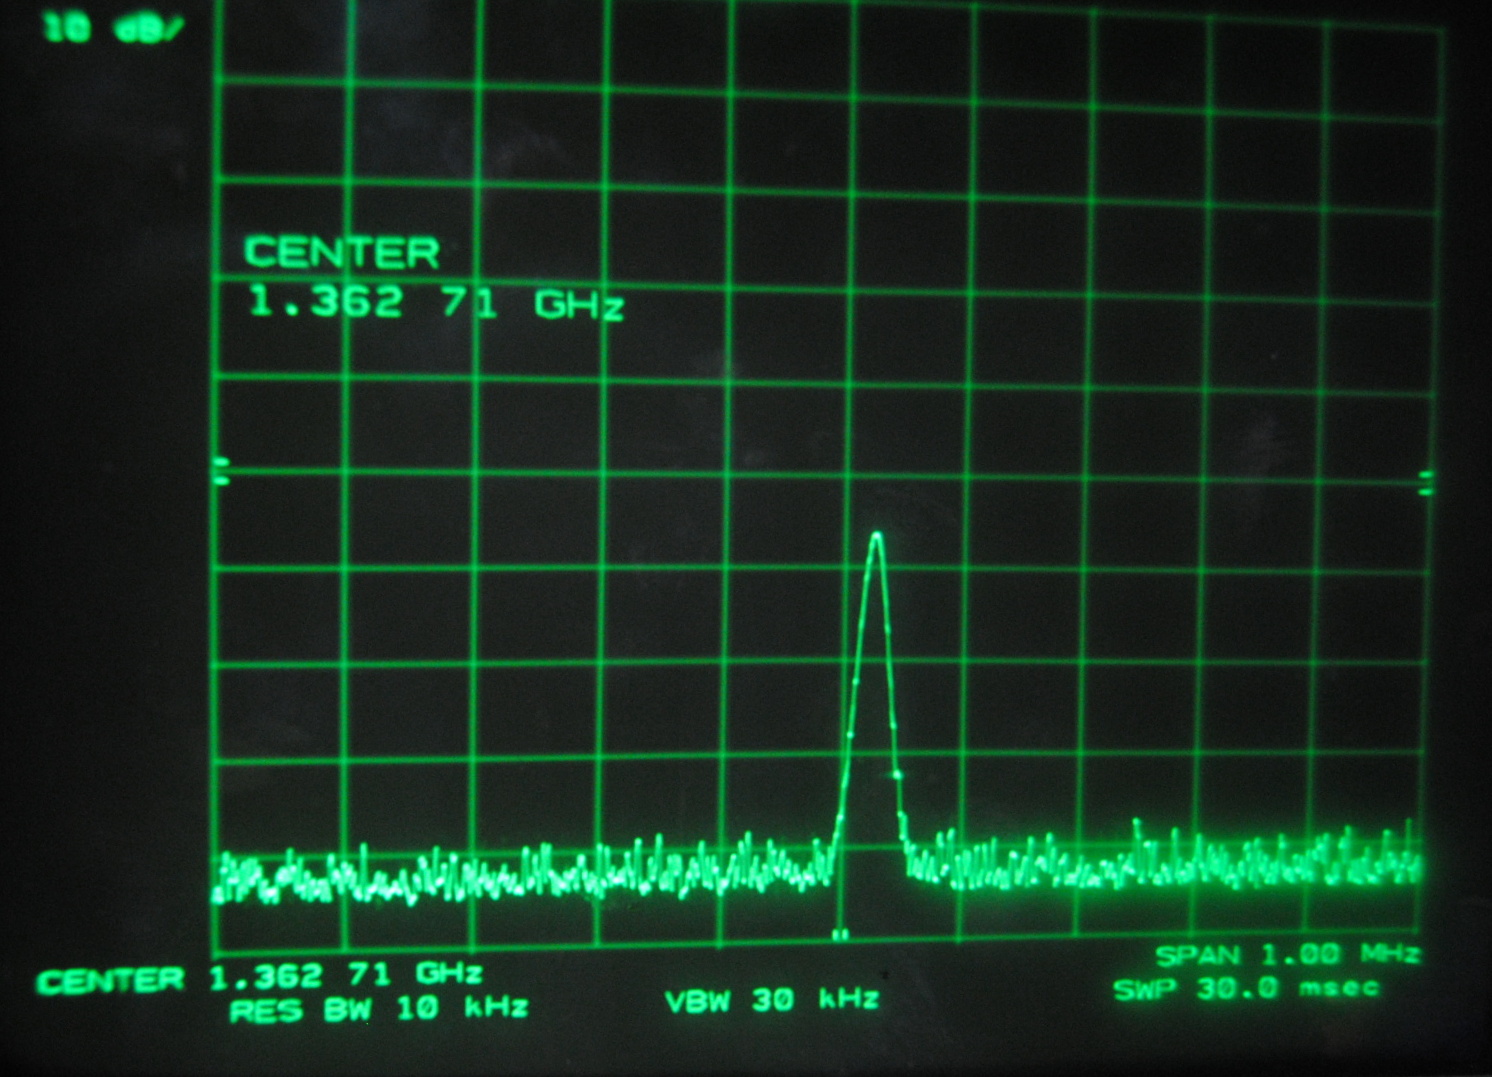
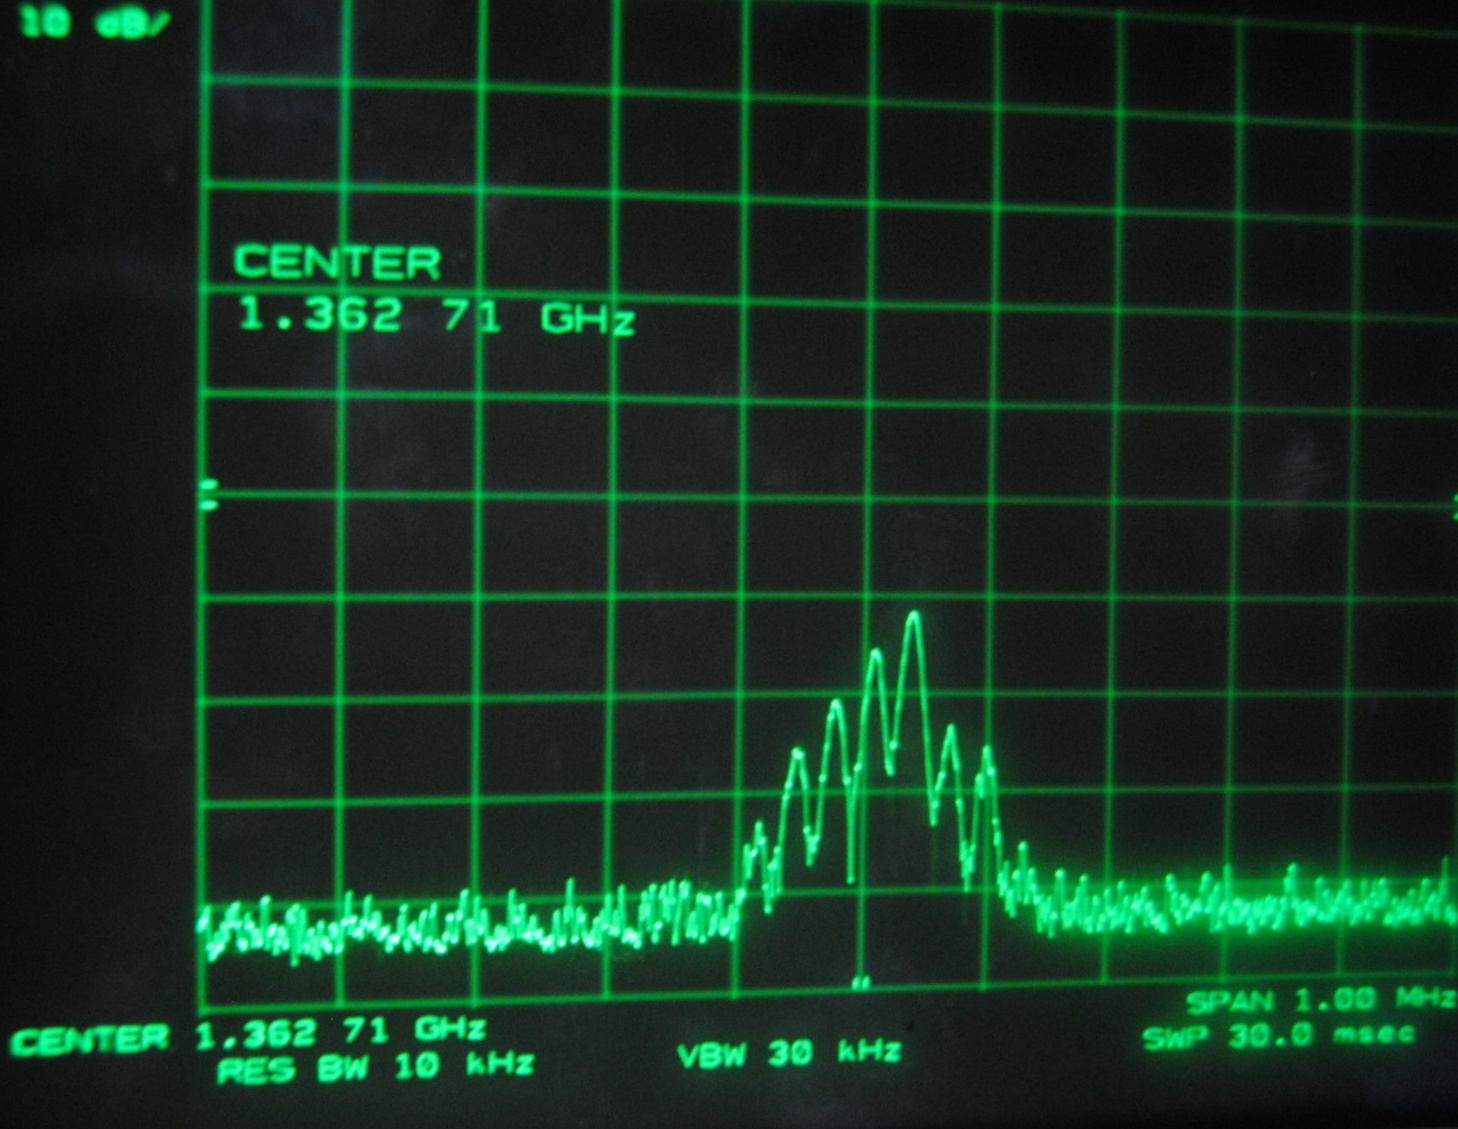
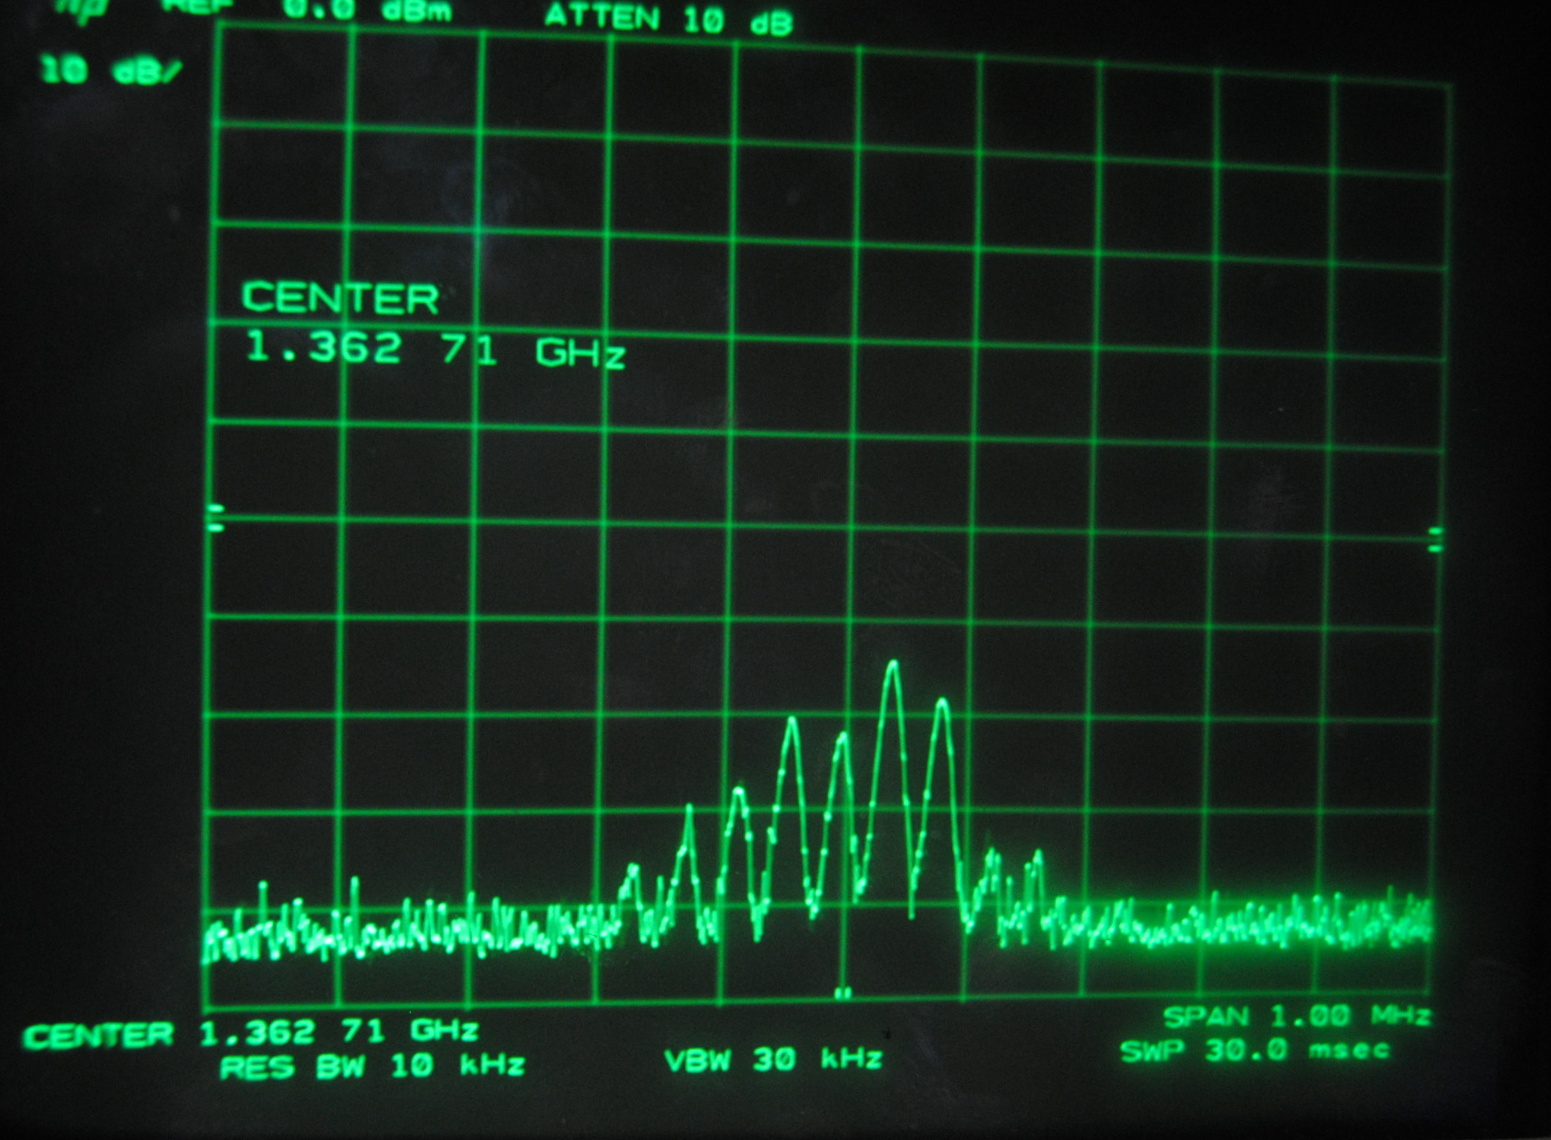
Above images centered at 1.362 GHz
Click on an image to see a larger version.
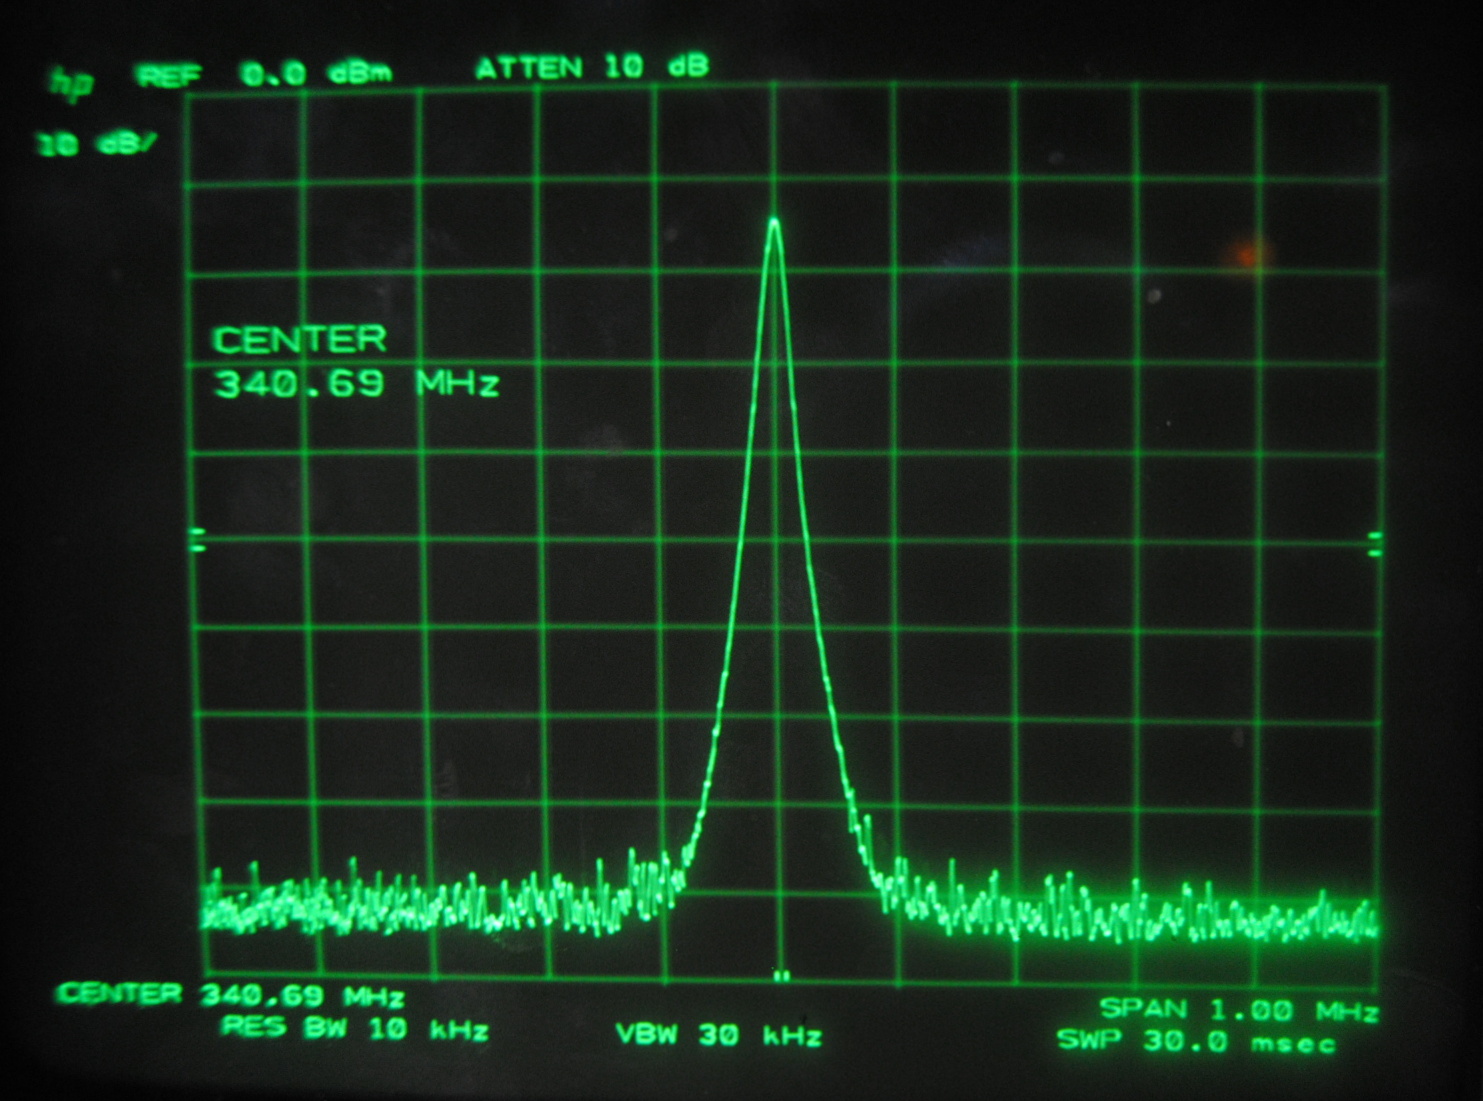
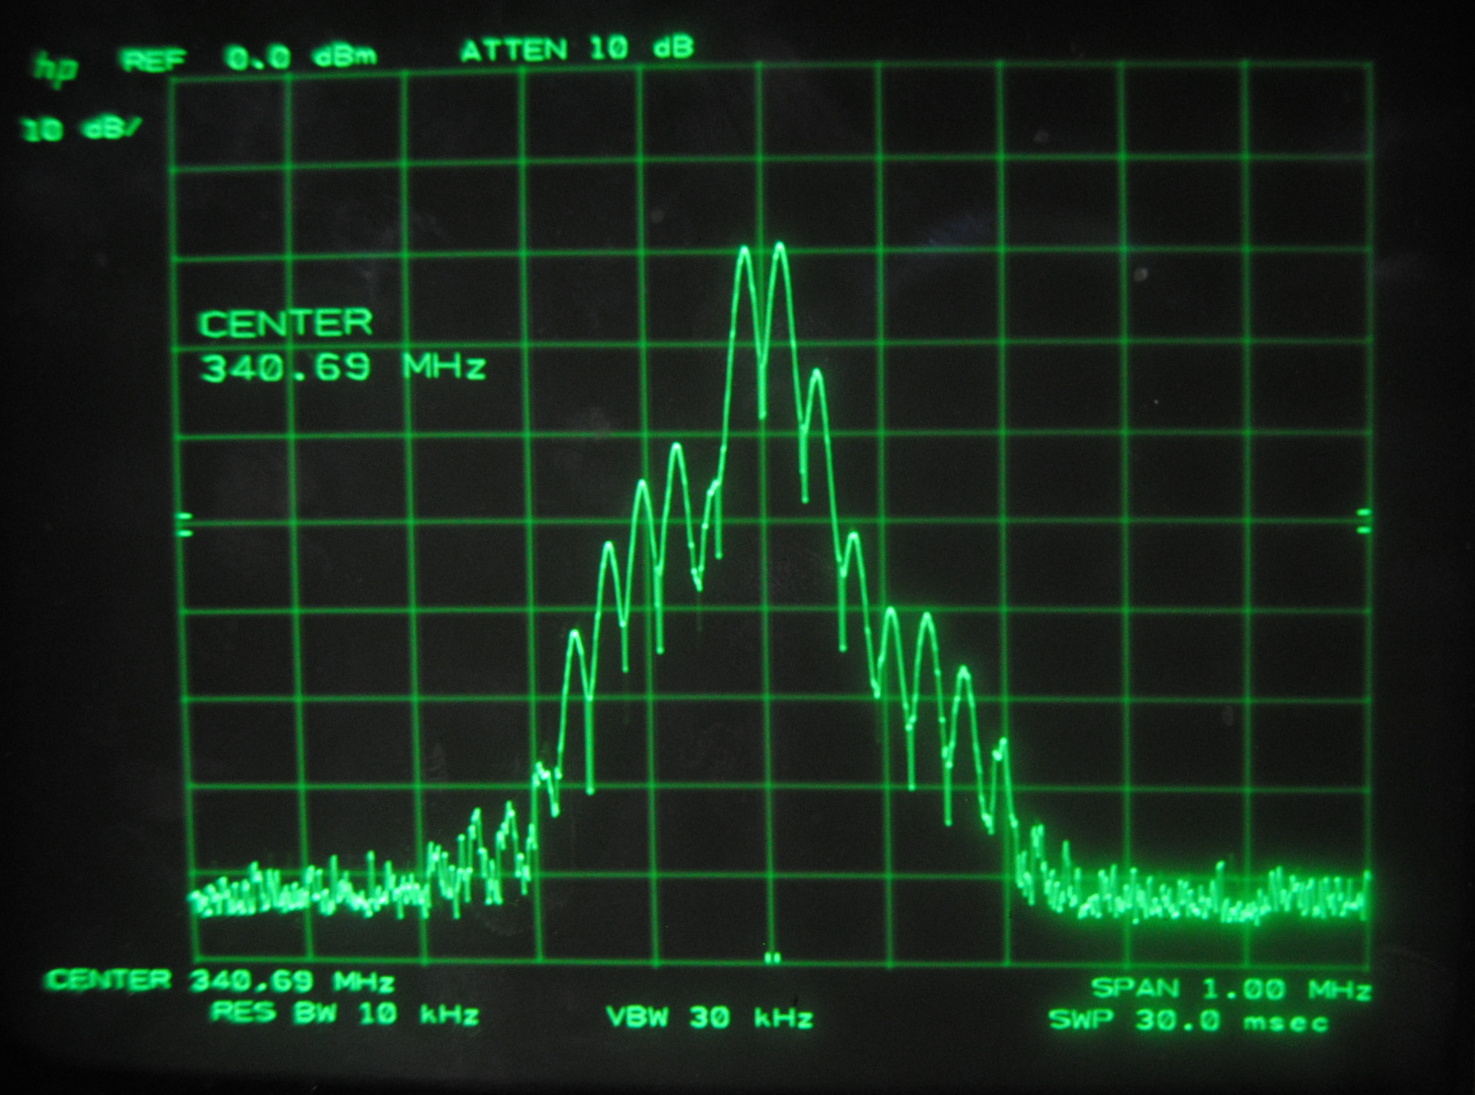
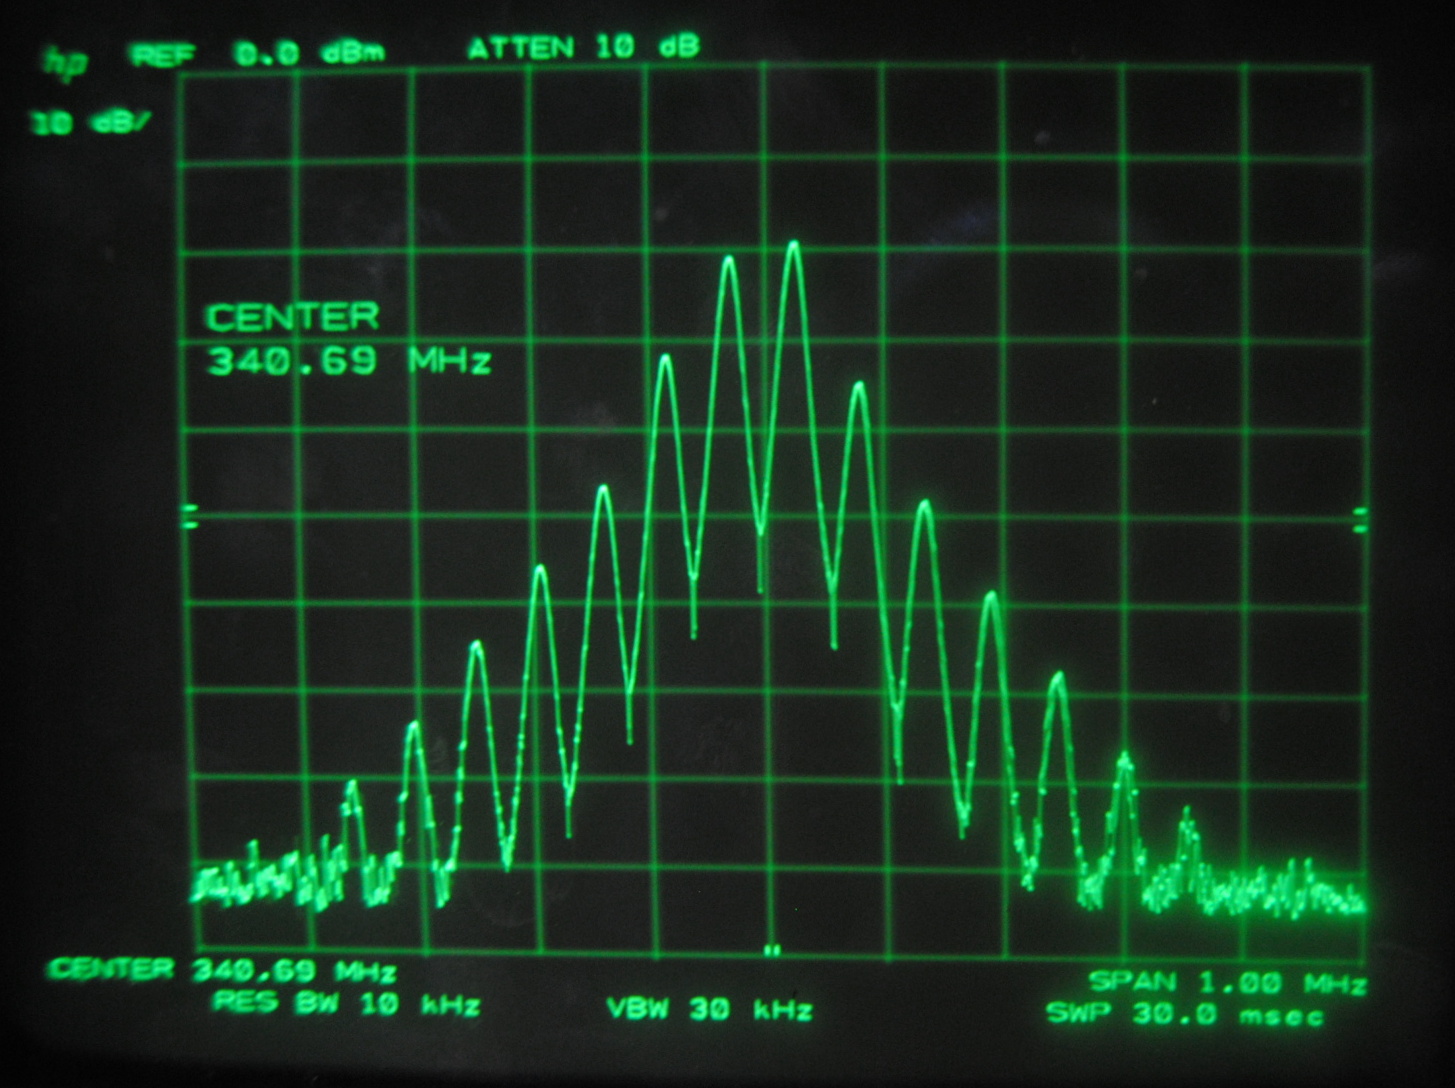
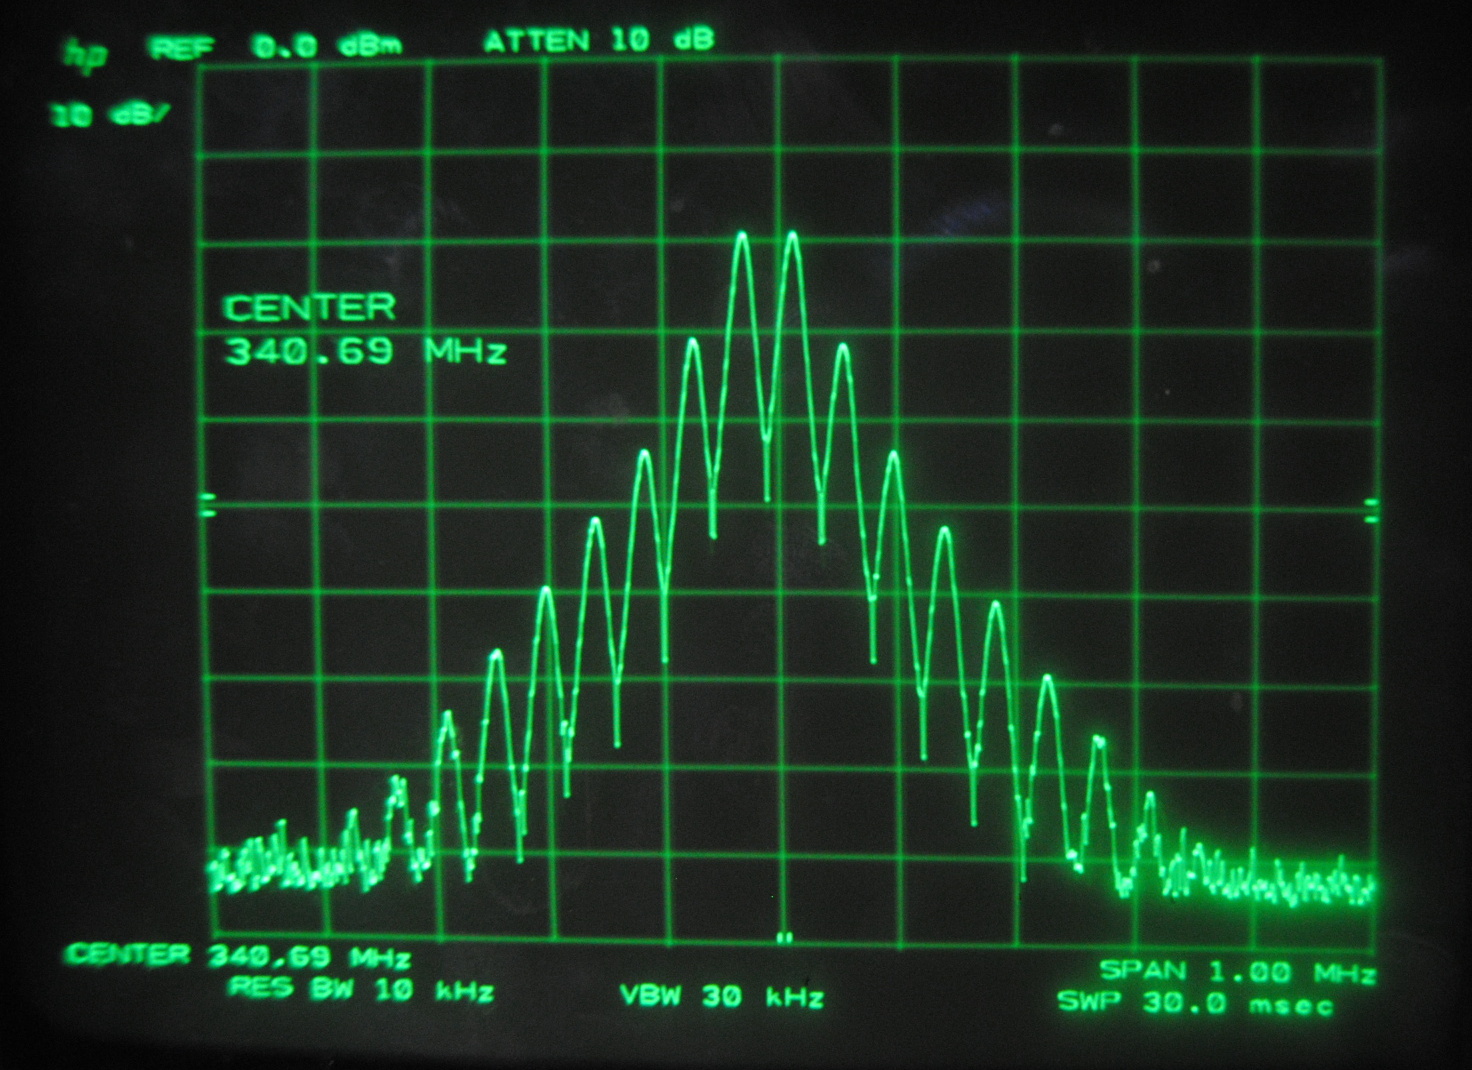
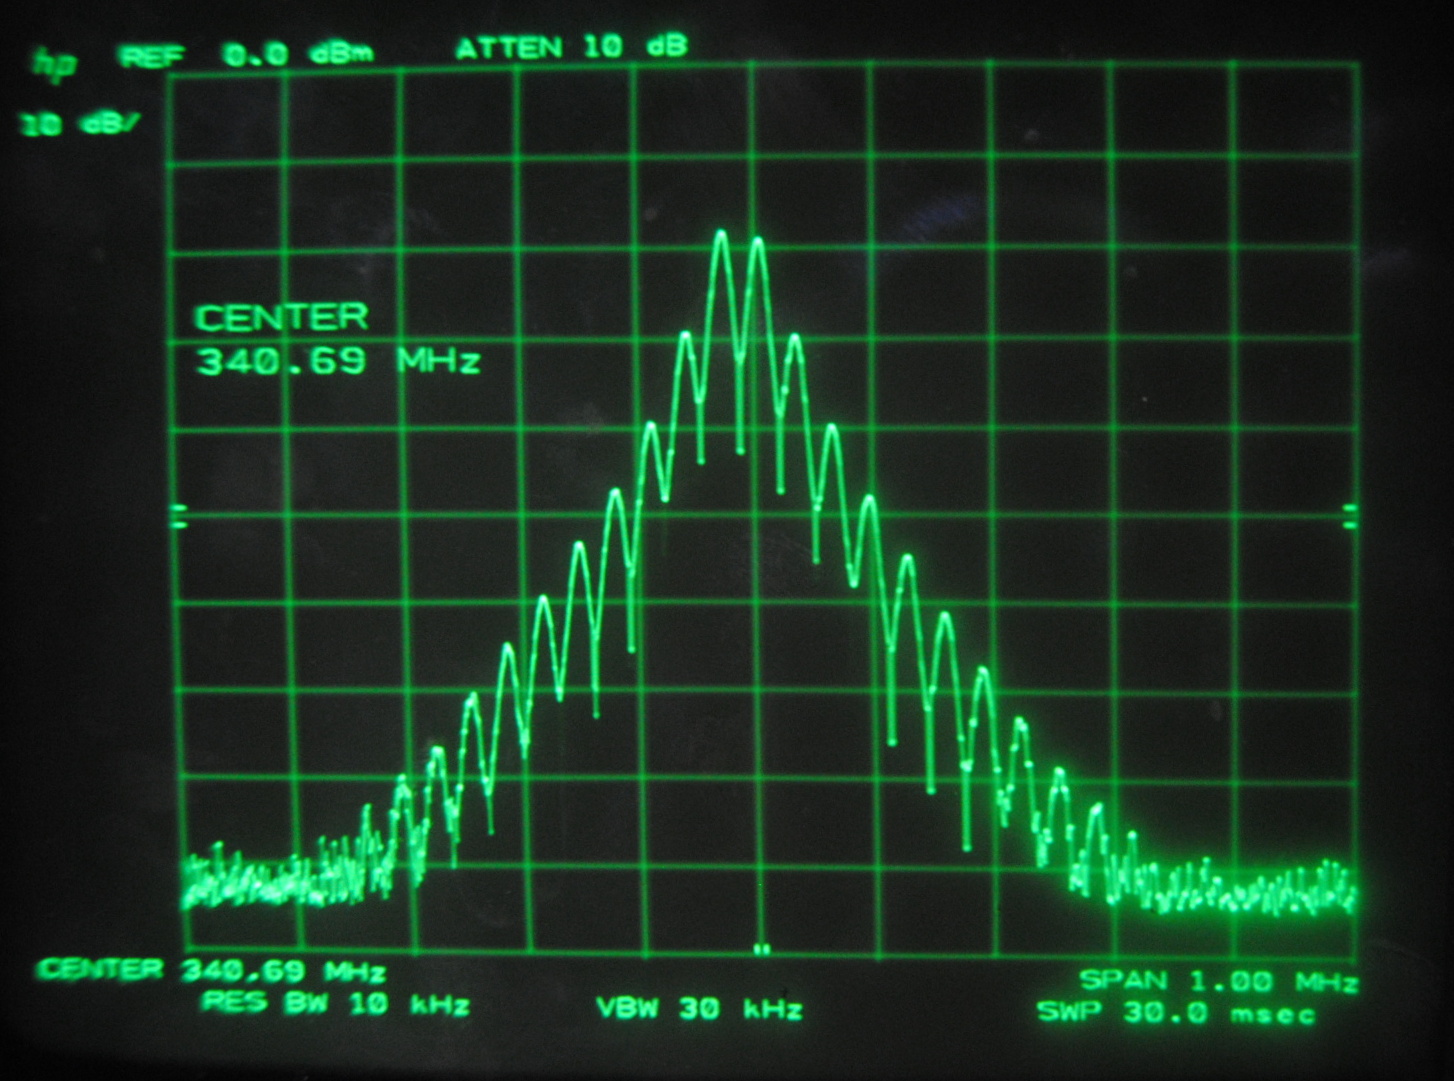
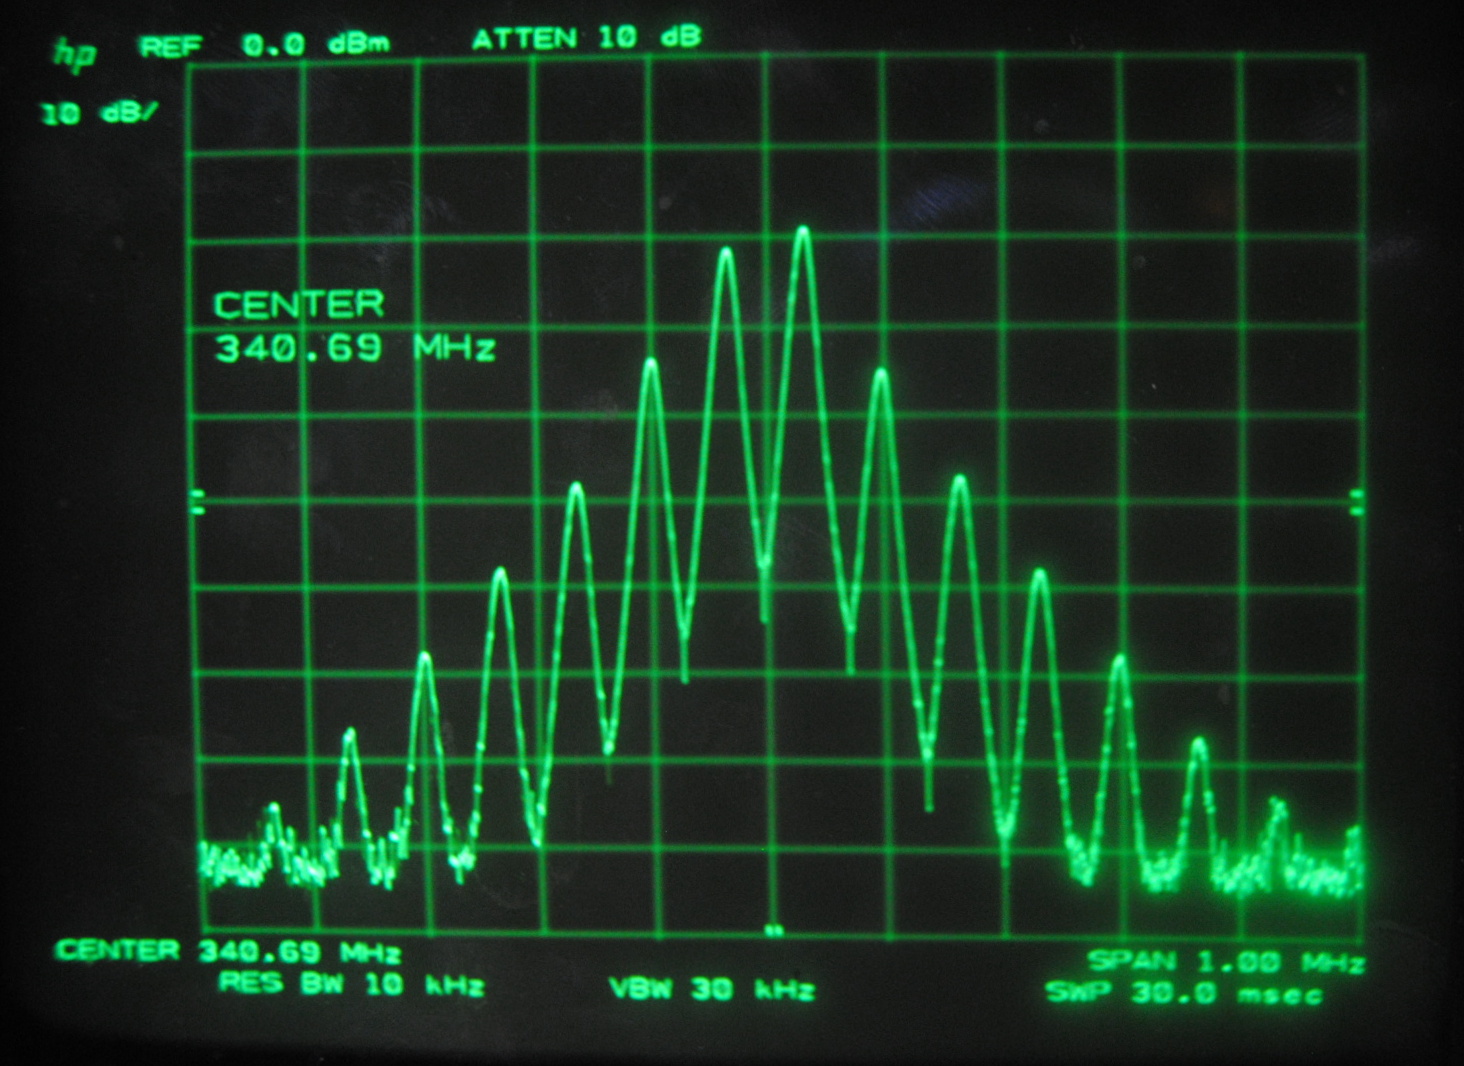
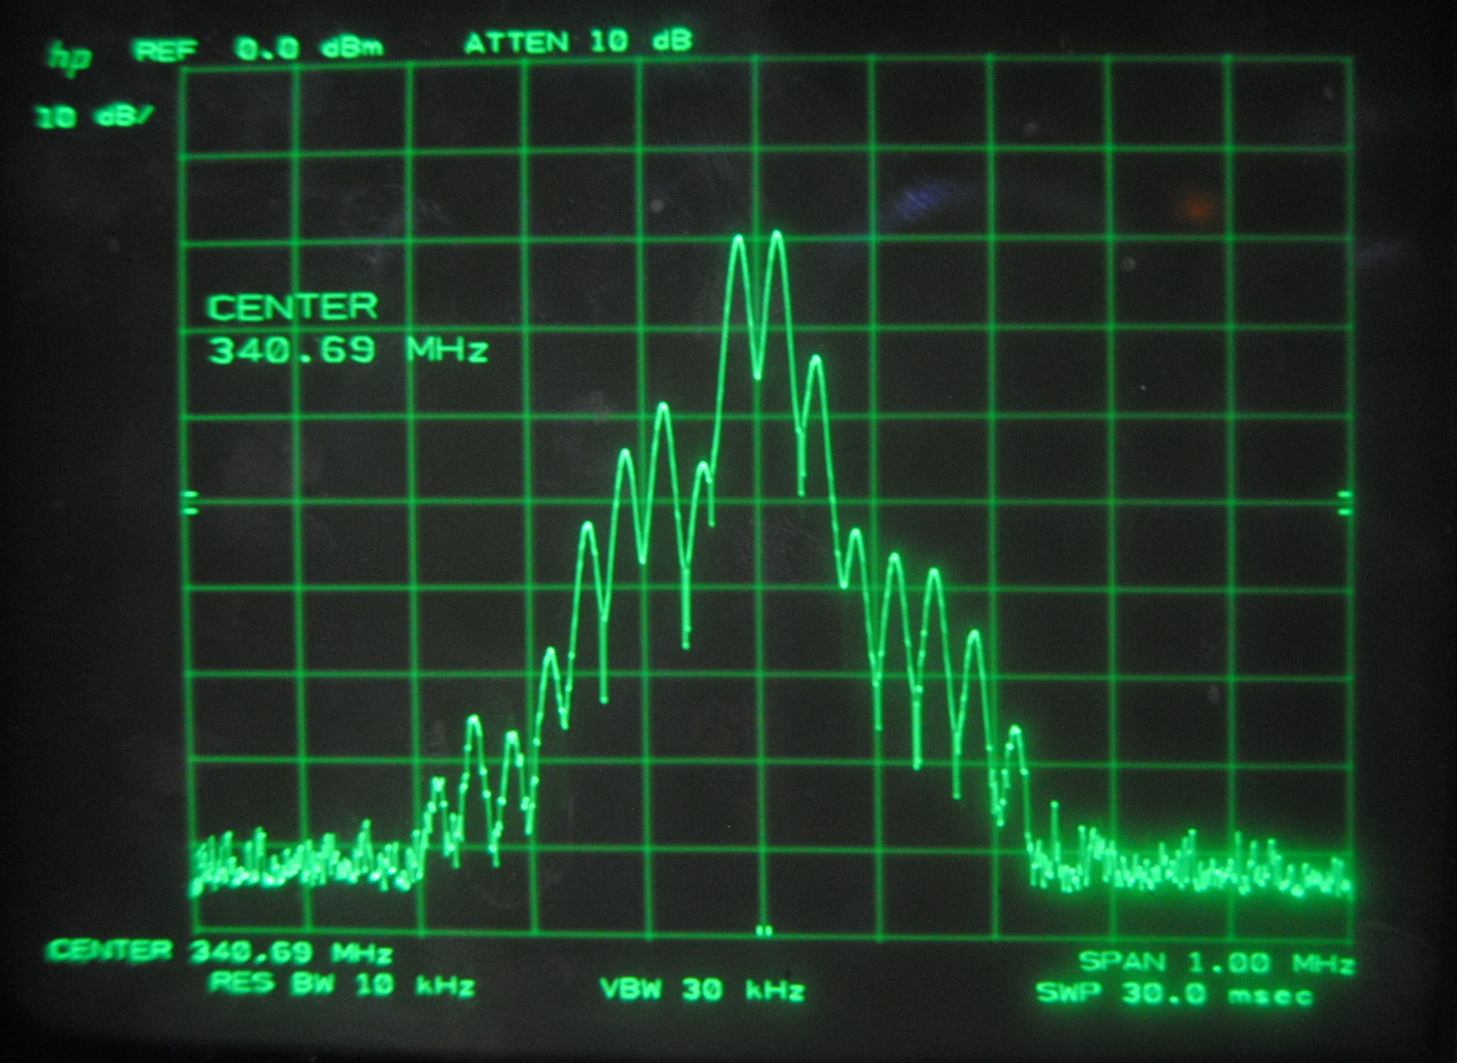
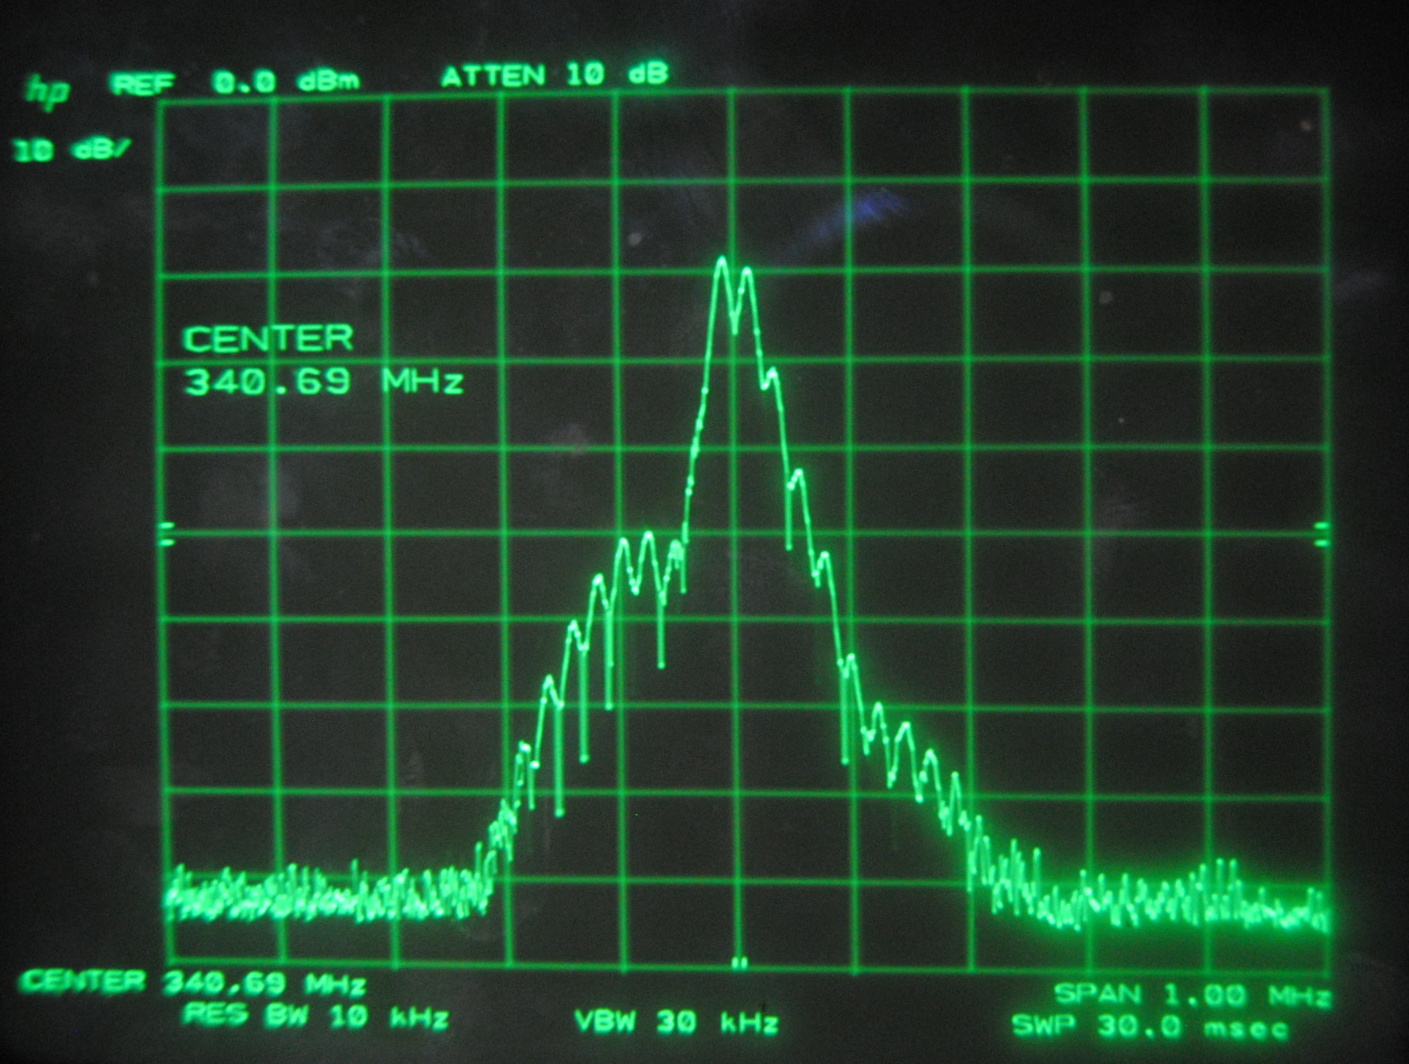
When we centered the spectrum analyzer window on individual beat frequencies in order to carefully study them we noticed a phenomena that seemed to parallel that
which we saw on the oscilloscope. The mode beats appear to break up into many smaller frequency peaks and oscillate between a very complex pattern and a uniform,
single peak.
Each set of images above corresponds to the mode beats of frequency Δf, 2Δf, 3Δf and 4Δf. It can be seen that the lower multiples of the beat frequency break up into more smaller peaks than the
higher multiples.
We knew that the beats were oscillating, but at this point we were able to make a more specific guess as to why. We believe that the smaller peaks represent the beat
of beat frequencies at that given moment in time. But this only begs the question:why do the number of beat of beat frequencies change periodically?
In order to answer this question we had to resort to more theoretical thinking and look at the "big picture" of the entire physical system inside the laser's cavity. The modes that are underneath the gain curve at any one given time will be amplified by the laser. We proved in an earlier section that Δf is the frequency difference between any two adjacent modes, so it follows that 2Δf is the frequency difference between any two modes that have one mode between them, etc. 6Δf represents the lowest and highest frequency modes being amplified at the time beating with one another, as they have the greatest frequency difference. It then follows that 6Δf is the width of this gain curve. It seems if the Neon gain curve is altered in any way, the various beat frequencies will be affected in number and intensity.
Based on our observations, the value of the beat frequency, Δf, is clearly not constant. We strongly believe that changes in the cavity's environment, such as mode sweeping, which occurs when the length of the laser changes due to varying temperature of the cavity, or mode pulling which occurs when the modes affect each other through their interactions with the gain medium, are what cause the modes to "wiggle" back and forth across the gain curve, resulting in the peculiar temporal effects on the oscilloscope and spectrum analyzer. It is interesting to note that these changes are cyclic; what does this say about the nature of the system? Perhaps through this process in which the modes affect the development of each other, certain ones become more prominent than others, limiting the amplitude of the others, thus creating a difference, this beat frequency. Based on our observations, this must occur periodically. As the modes sweep across the gain curve, at different times there are different numbers of modes underneath it. The time when the most possible modes are underneath the gain curve is when the beat frequency peak (from the spectrum analyzer data) is rough and jagged, when the beats of beats are most numerous. The time when the least possible modes are underneath the gain curve at any one given time is when the beat frequency peak is smooth, when the beats of beats are least numerous.
Conclusion
In this project we mostly investigated the longitudinal modes of two long HeNe lasers. We learned that lasers can be described as resonant systems that can support longitudinal modes if there frequency matches an integer number of half wavelengths that can fit inside the length of the laser cavity. We found that the successive beat frequencies were integer multiples of "c/2L", or the beat frequency of any two of the adjacent modes. We discovered that the number of beat of beat frequencies existing at any one given time oscillates. We hypothesized that this was due to changes in the environment of the laser cavity such as mode sweeping and mode pulling, caused by the warming up of the laser influencing the cavity length, and the interactions that modes have with each other through the gain medium. We confirmed that the temperature affects the number of beat of beats by leaving the laser on over night and observing the beats on the spectrum analyzer; we found that the oscillations slowed down. However, the structure of the peaks and their jagged pattern stayed largely the same over time. This would seem to suggest that the mode-mode interactions through the gain medium are the major influence of the structure of the peaks and their oscillations. A future goal of ours is to understand why the rough peak from the spectrum analyzer data is so chaotic. There seem to be too many small peaks to be explained for based on the number of modes and mode beats known to exist at the time. We would also like to compare the beat of beat oscillation patterns of lasers of various lengths.
Acknowledgements
We thank Dr. Sam Goldwasser for providing most of the lasers used in this project, some laser diagrams, and for invaluable technical advice. We also thank our mentor Dr. Noe for guiding us and teaching us about optics this semester.
References
Sam Goldwasser's (AKA Laser Sam) amazing Laser FAQ.
A Wikipedia article about Lasers in general.
A Wikipedia article about Helium-Neon Lasers.
A Wikipedia article about Gaussian Beams and how to model them mathematically.
A Wikipedia article about Transverse Modes.
A Wikipedia article about Longitudinal Modes.