Understanding Photometry
and Incandescent Light Sources
Carolyn Kiriakos
Laser Teaching Center
Department of Physics and Astronomy
Stony Brook University
Introduction
My project began out of simple curiosity. One day, while researching light emitting diodes for another project idea, I came across a unit that I had never heard of: the candela. This originally piqued my interest because, despite my tendency toward math and physics, I really enjoy learning about foreign languages. Figuring that "candela" meant "candle" in some language, I wanted to find out which one that was (it turned out to be Latin). However, I also began to read about what a candela actually was, and how its definition had changed over time. From there, I saw that there was a distinction between radiometric and photometric units, which I did not know much about at the time. Upon discussing this topic with Dr. Noé, I found out that the system of units behind photometry and radiometry, as well as the process for converting between the two types of units, was rather complicated (at least compared to other types of unit conversion), and frankly more than a little confusing to me. I then decided to do a project which sought to explain the differences between these two different methods of measuring light. I also attempted to convert a photodetector, an instrument that is meant to measure light in radiometric units, into a photometer by placing an appropriate filter in front of it. Lastly, I tested out the principles of photometry that I had learned by taking measurements of the light emitted by three different incandescent light bulbs. By correcting for the different sensitivities of the photodetector to different wavelengths of light and accounting for the different percentages of radiation emitted by the light bulbs at different wavelengths, I was able to obtain experimental values for both the power of the light emitted by the bulbs and their electrical power.
Photometry
Photometry refers to the measurement of the intensity of electromagnetic radiation as perceived by the human eye. The units in this system of measurement are adjusted for the different human spectral sensitivities to certain wavelengths of light, which are discussed below. Photometry could be contrasted with radiometry, which measures light in absolute units. The distinction between the two is given subtly by the etymological roots of the words. "Photometry" comes from the Greek words "photos" and "metron," meaning "light" and "measure" respectively, while "radiometry" derives from the French prefix "radio-" as well as the Greek "metron." While some people define "photos" specifically as radiation to which the organs of sight react, "radio-" refers more simply to radiant energy, which is defined generally as that which is propagated by radiation.
Human Spectral Sensitivity
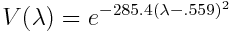
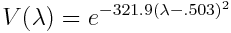
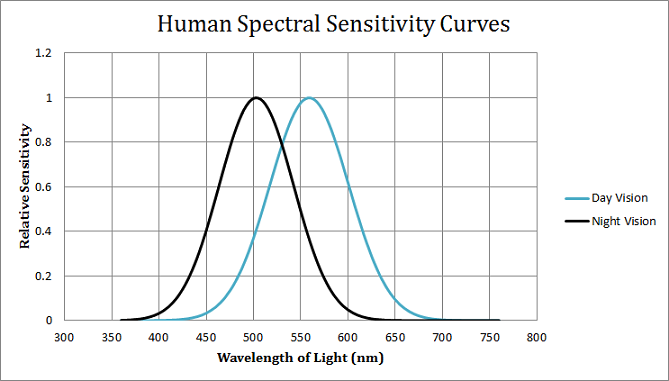
As mentioned earlier, the human eye has different sensitivities to different wavelengths or colors of light. This sensitivity peaks between 550 and 550 nanometers for day vision (referred to as photopic vision) and between 505 and 510 nm for night (scotopic) vision. Both of these ranges correspond to green light, which is why the images given by night vision devices have a characteristic green tint. These curves differ, however, because the rods within the eye, which correspond to black and white vision, become more active in low-light situations, while the cones become less active. This serves to change the human perception of color at night. The functions which describe the relative sensitivities of the eye for both day and night vision (in that order) are given below and shown on the following graph.
Using Photometry to Analyze Incandescent Light Bulbs
The principles of photometry can be readily applied to incandescent light sources since ratings in both Watts, a radiometric unit of power, and lumens (the photometric equivalent of power) are often given on light bulb packaging. However, the radiometric power given there reflects the number of Watts the bulbs draw from an outlet, not the actual power of the light they emit at any given distance from the bulbs. My goal, then, was to determine the total power of this emitted light, as well as what portion of it was emitted within the visible spectrum, by taking several measurements of the light "intensity" using a photodetector and three different incandescent light sources. However, in order to properly calculate this value, I had to take into account both the sensitivity curve of the photodetector and the black body curve which describes the different amounts of radiation given off by the bulbs at each wavelength within the electromagnetic spectrum. I also attempted to convert the photodetector into a photometer by placing a green filter in front of it to imitate the human spectral response, but, as discussed later on, this did not go according to plan.
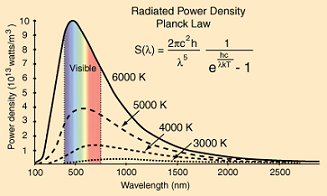
Black Body Curve
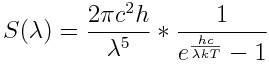
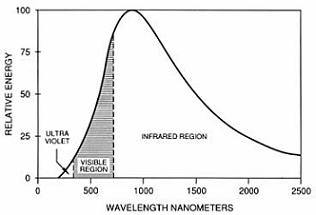
The black body curve gives a measure of the power of the light emitted at each wavelength in the electromagnetic spectrum by a source of radiation as a function of its absolute temperature. In the case of incandescent light bulbs, which typically operate at temperatures between 2780 and 2880 K, this curve shows that the vast majority of the energy given off by such bulbs exists outside of the visible spectrum, particularly in the infrared. In fact, this function, which is given below, estimates that the percentage of the energy used by an incandescent bulb operating at 2850 K which is converted to visible light is only 10.76%. When considering only the middle of the visible spectrum, that is, the range between 500 and 600 nm at which the human spectral sensitivity peaks, this number drops to 2.06%. The figure on the lower left, which can also be found on HyperPhysics, illustrates the black body curves for sources of radiation at several different temperatures. The graph on the lower right is essentially a rescaled version of the other figure which more clearly shows the shape of the function for the approximate temperature at which an incandescent bulb typically operates.
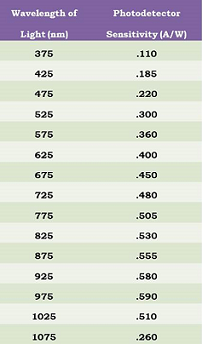
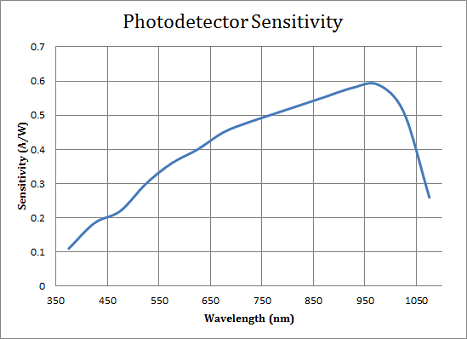
Photodetector Sensitivity Curve
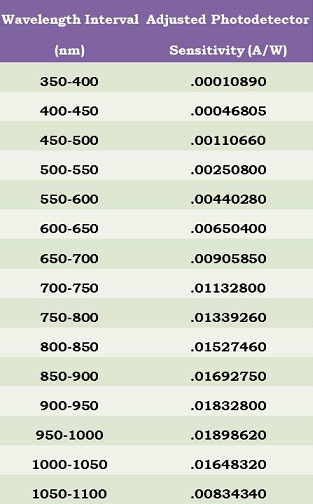
Equally important for this project was the sensitivity curve of the Thorlabs DET-110 photodetector I used to measure the light coming from each of the light bulbs in my experiment. This curve peaks around 960 nm, which is well within the infrared spectrum, and therefore does not correspond to the human spectral sensitivity curve. A table with specific values for the photodetector sensitivity at several wavelengths between 375 and 1075 nm that I determined visually based on a graph of its sensitivity curve are given below, as well as a sensitivity curve that I generated based on these values.
Weighted Photodetector Sensitivity
Ultimately, in order to make my measurements of the radiated light meaningful, I had to account for both the black body curve and the photodetector sensitivity curve which affected my results. This was accomplished by first computing the percentage of the black body radiation emitted within several 50 nm intervals between 350 and 1100 nm using this calculator. Then, after determining the photodetector sensitivity at the center of each of these intervals, I multiplied the corresponding values for each wavelength interval to obtain weighted values for the photodetector sensitivity within each of these intervals. The sum of these adjusted values then gave the average weighted photodetector sensitivity, which came out to be .1432 A/W. Tables containing the black body percentages and weighted photodetector sensitivity values for a variety of wavelengths can be found below.

Luminous Efficacy
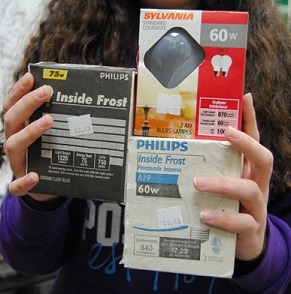
Another important measurement to consider is the luminous efficacy of a light bulb, which is defined as the number of lumens of visible light given off per Watt of electrical power used. This quantity essentially gives a measure of how efficient or inefficient a light source is. Typical luminous efficacies of a 40 W, 60 W, and 100 W incandescent bulb are 12.6 lm/W, 14.5 lm/W, and 17.5 lm/W. Based on the electrical power and luminous flux ratings given on the packaging of the light bulbs I used, their theoretical luminous efficacies were found to be: 14.5 lm/W, 16.3 lm/W, and 14.0 lm/W for the Sylvania 60 W, Philips 75 W, and Philips 60 W bulbs, respectively.
Experiment
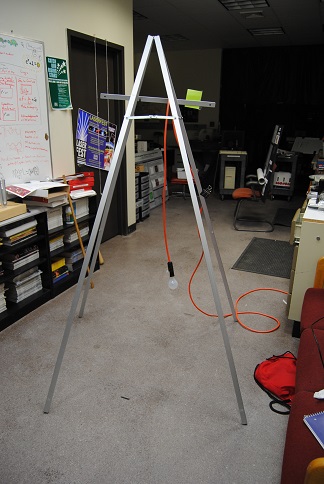
Setup and Procedure
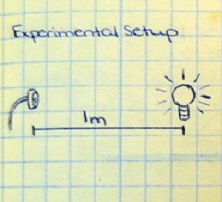
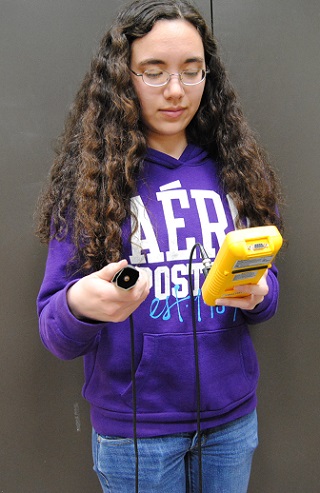
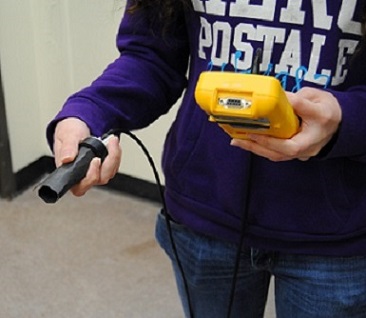
I used three different light bulbs in my experiment, which are described in a table in the Data section below. Measurements were taken 1 meter away from the center of the light bulbs, which were handheld vertically with the round portion of the bulb pointed upwards. A 100 kΩ resistor was placed across the photodetector, which served to convert the small currents generated by the bulbs into more noticeable voltages. The readings that I obtained are given in the next section.
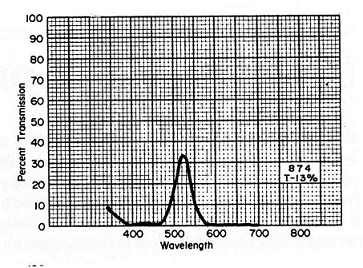
For half of my measurements, I also placed a medium green filter, made by the Edmund Scientific Company, in front of the photodetector in an attempt to imitate the human spectral response. This filter's sensitivity curve, which is given below and was taken from this web page, peaks in roughly the same wavelength range as that of the human eye. The "T-13%" label on the graph indicates that the filter should have ideally transmitted 13% of the light coming from an incandescent source. However, it remains unclear whether this figure refers only to visible light or to all electromagnetic radiation.
Dr. Noé and I later repeated my measurements with the light bulbs hanging from a tripod to check for error caused by the shadow of the person holding the bulbs. However, no significant difference in the voltage measurements was found.
To eliminate any potential impact from outside light sources, we also surrounded the photodiode with a cylinder of black paper to block out the reflections and light coming from any direction other than that of the light bulb. The difference in the readings taken with this setup compared to those measured without the paper was also found to be negligible.
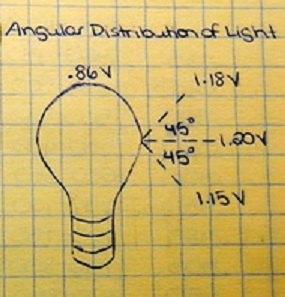
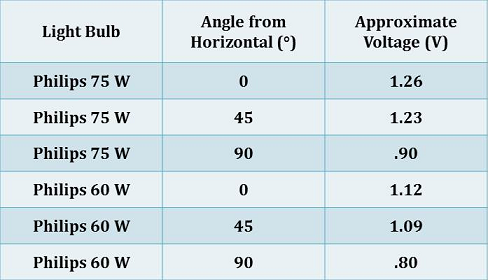
Dr. Noé and I also chose a single light bulb (the Sylvania 60 W one) and took some additional measurements to describe the angular distribution of the light it emitted. The photodetector was held at different angles and positions with respect to the bulb, and the voltage observed at each of these locations was recorded. Our findings are summarized in the figure below.
Data
The voltage measurements obtained during the first portion of my experiment are given in following table.
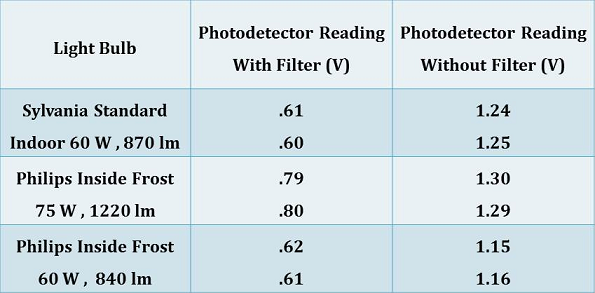
The voltages given by the photodetector while the green filter was in front of it did not seem to agree with the transmission percentages given by the filter's sensitivity curve. The filter seemed to be allowing a much larger portion of the light coming from the bulb through it than the curve indicated. For this reason, I chose to focus on the measurements taken without the filter for the rest of my analysis.
Furthermore, since the angular distribution of light is approximately the same for all similarly-shaped incandescent bulbs, I was able to extrapolate and apply the results we obtained for the Sylvania 60 W light bulb to the other two bulbs. Using the same ratios between the measurements at different angles, I obtained the following estimates for the angular distributions of the light emitted from the Philips 75 W and Philips 60 W bulbs.
Analysis
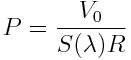
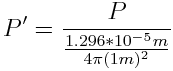
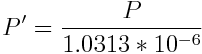
I used the formula below to determine the power of the light emitted from the bulb at a distance of 1 meter. Here, P = the power of the emitted light, V0 = the output voltage given by the photodetector, S(λ) = the average weighted photodetector sensitivity calculated earlier, and R = the resistance placed across the photodetector. For this calculation, the output voltage of each bulb represents a spatial average of the voltage values we obtained when considering the light sources from different angles to the horizontal. We estimated this average to be approximately 85% of the voltage value obtained when measuring a light bulb at its equator since the portions of the bulb near the center, which have higher voltage output readings, occupy a larger area.
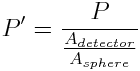
In order to properly calculate the total power of the light radiated by the bulbs, I also had to consider the ratio of the area of the photodetector to the area of the spheres of light which radiated from the sources. In this case, the spheres which we were considering had a radius of 1 m, since all of the measurements were taken from a distance of 1 m away. Therefore, the surface area of this sphere was found to be 4π based on the simple geometric formula for the surface area of a sphere.
The steps I followed to convert the average power of the light detected at a distance of 1 m, P, to a value for the total power of all of the light radiated from the bulb, P', are shown below. The table gives the final experimental values I obtained for both the average power of the emitted light at a distance of 1 m and the the total radiated power.
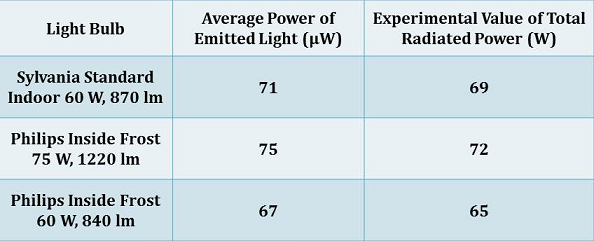
The numbers that we obtained for the total radiated power of the light bulbs were much larger than expected. Theoretically, these numbers should not have exceeded the electrical power ratings given on the light bulb packaging, and may have been as much as 50% lower than those ratings to account for the power losses which occur when heat is conducted and radiated by the glass bulb at a lower temperature than that of the filament. It is possible that the photodetector I used to take my measurements was more sensitive to longer wavelength, particularly infrared, light than was suggested by its sensitivity curve. This would also help to explain why the measurements taken with the filter in front of the photodetector came out higher than we anticipated.
Conclusions and Unanswered Questions
One of the main things that I gained a better understanding of through this project was just how inefficient incandescent light sources are. The majority of the energy that is used up by such sources is given off as heat, which is clearly less useful in this case, instead of visible light. People are now being encouraged to purchase and use compact fluorescent light bulbs since bulbs which operate at higher temperatures, like CFLS, tend to be more energy efficient.
I also learned that luminous flux is a much better indicator of the apparent brightness of a light bulb than electrical power, which merely describes the amount of Watts that a device draws from an outlet. The rating given in lumens only considers visible light, which is obviously what most people are looking to get from light bulbs. It is still somewhat unclear, though, how the companies that manufacture light bulbs obtain these luminous flux ratings.
Furthermore, it remains to be seen why our attempt to convert the photodetector to a photometer using the green filter was so unsuccessful. Based on the ratio between the voltage measurements I obtained with and without the filter in front of the photodetector, the filter seemed to be transmitting a much larger percentage of the light passed through it than it should have based on the sensitivity curve. According to that curve, the maximum transmission that should have occurred for any given wavelength of light was 34%. However, Dr. Noé and I consistently observed that the filter transmitted nearly 50% of the white light incident on it. The fact that the filter's sensitivity curve did not peak at the same value as the human spectral one may have contributed to the error in my experiment, but the difference between the two curves did not seem to be large enough to explain these drastic results.
In general, however, the photodetector that I used does not detect approximately 70% of the light incident on it since only about 30% of all black body radiation emitted from a source has wavelengths between 350 and 1100 nm, which is the range over which the photodetector is capable of measuring radiation. Although theoretically most of the light I was looking to measure should have been within this range, the fact that the photodetector misses this much light makes the measurements I took somewhat imprecise. Furthermore, as mentioned earlier, the photodetector seemed to have at least a slightly different sensitivity, especially at longer wavelengths, than what was suggested by the sensitivity curve I found for it.
Acknowledgements
I would like to thank Dr. John Noé for dedicating his time and effort to my project, as well as Dr. Marty Cohen for helping us to understand the science behind incandescent light sources. A special thanks also goes out to the WISE program and all of those at the Laser Teaching Center for giving me this opportunity to be introduced to research so early on in my college career. Lastly, I would like to thank Angela Pizzuto and Rachel Sampson for assisting me with some of my light bulb measurements and, more importantly, for sharing the WISE 187 experience with me.
References
1. "DET 110-High-Speed Silicon Detector." Thorlabs Inc. http://www.thorlabs.com/thorcat/ 2100/DET110-SpecSheet.pdf
2. Erhardt, Louis. Radiation, Light, and Illumination. 1977. Print.
3. Greene, Nathaniel R. "Shedding Light on the Candela." The Physics Teacher. Vol. 41, October 2003. http://scitation.aip.org/getpdf/servlet/GetPDFServlet?filetype=pdf&id= PHTEAH0000410000070000409000001&idtype=cvips&doi=10.1991/1.1616481&prog=normal
4. "Luminous Efficacy." Farlex Inc. http://encyclopedia2.thefreedictionary.com/luminous+ efficacy
5. Nave, R. "Power Radiated from Blackbody." Department of Physics and Astronomy, Georgia State University. http://hyperphysics.phy-astr.gsu.edu/hbase/quantum/radfrac.html#c1
6. Palmer, James M. "Radiometry and Photometry FAQ." Optical Sciences Center, University of Arizona. http://fp.optics.arizona.edu/Palmer/rpfaq/rpfaq.htm
7. Sacek, Vladimir. "Eye Spectral Response." http://www.telescope-optics.net/eye_spectral_ response.htm
8. Schlyter, Paul. "Radiometry and Photometry in Astronomy." http://stjarnhimlen.se/comp/ radfaq.html#1
9. Schubert, Fred E. "Human Eye Sensitivity and Photometric Quantities." Department of Electrical, Computer, and Systems Engineering, Rensselaer Polytechnic Institute. http://www.ecse.rpi.edu/~schubert/Light-Emitting-Diodes-dot-org/Sample-Chapter.pdf