|
Project GoalThe goal of this project was to investiage the linearity of a curved
position sensitive x-ray detector.
IntroductionX-ray powder diffraction is a technique that is used to gain information about the atomic structure of crystalline materials. X-rays illuminating a sample are scattered by atoms in the crystals and interfere constructively and destructively. The interference pattern created by these x-rays is detected and a specturm of x-ray counts vs. scattering angle (2 theta) is obtained. The postion and intensities of the peaks in this spectrum can reveal information about which atoms are present and in which phase.
Often a point-to-point detector is used to record the x-ray spectra. This
detector counts the number of x-rays present at one position. The
detector is then swept over the 2 theta range to record the whole
spectrum. For certain situations, however, it is advantageous to be able
to record the entire spectrum at once. One might want to observe the
spectrum as a function of time as a phase transition or some other
reaction
took place. The detector I investigated was of this type. It was an
extended detector, curved in order to span a 2 theta range of about 45
degrees.
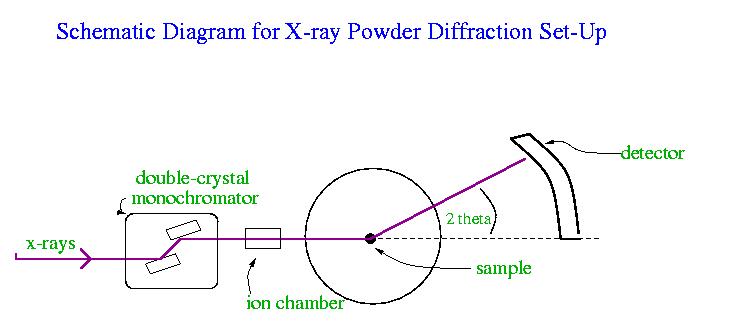
Experimental SetupThe following diagram displays the experiemental setup.
The source of x-rays was the synchrotron light source. The sample used
to test the detector was Alumina (Al2O3). The
double-crystal monochromator selects the wavelength of the x-rays and the
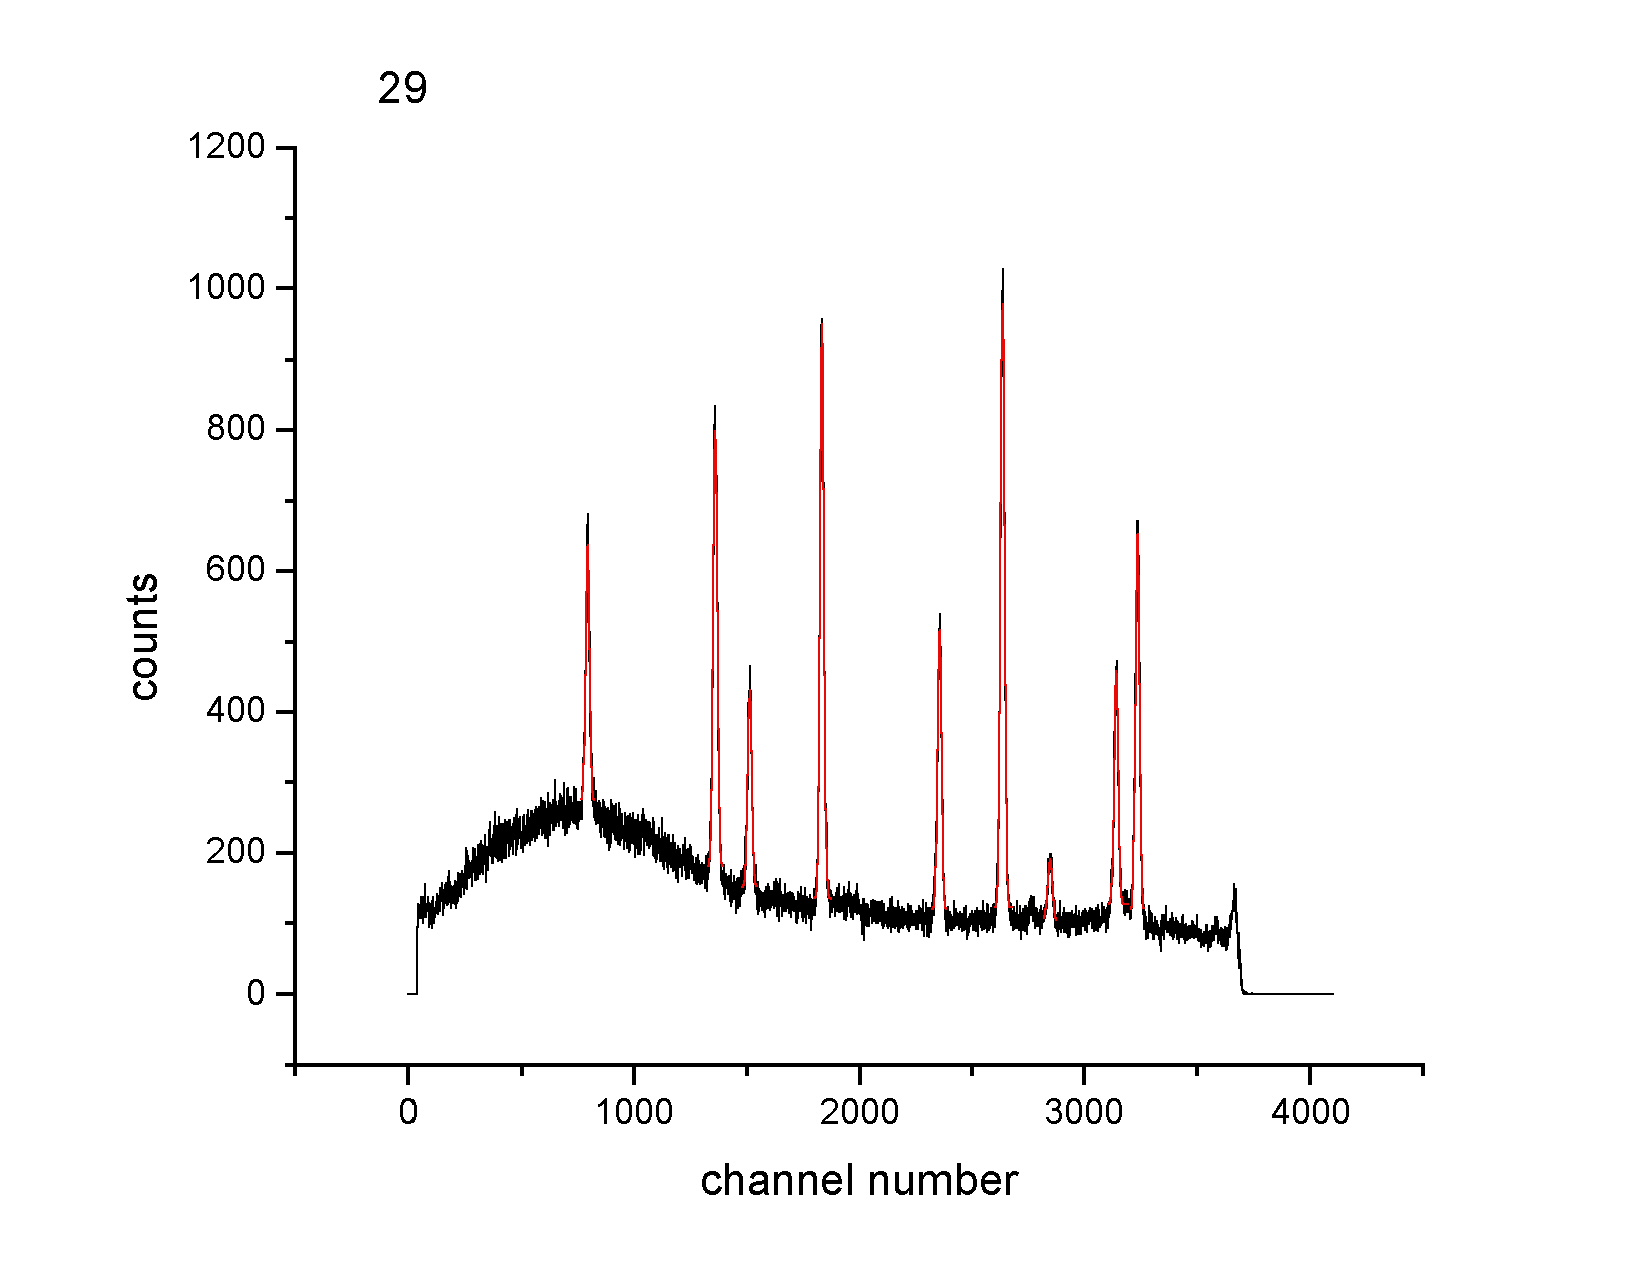
ion chamber is used to determine the intensity of the x-ray beam. ResultsTwenty spectra were obtained, each with the detector moved 0.5 degrees. The following is an example of one of the spectra.
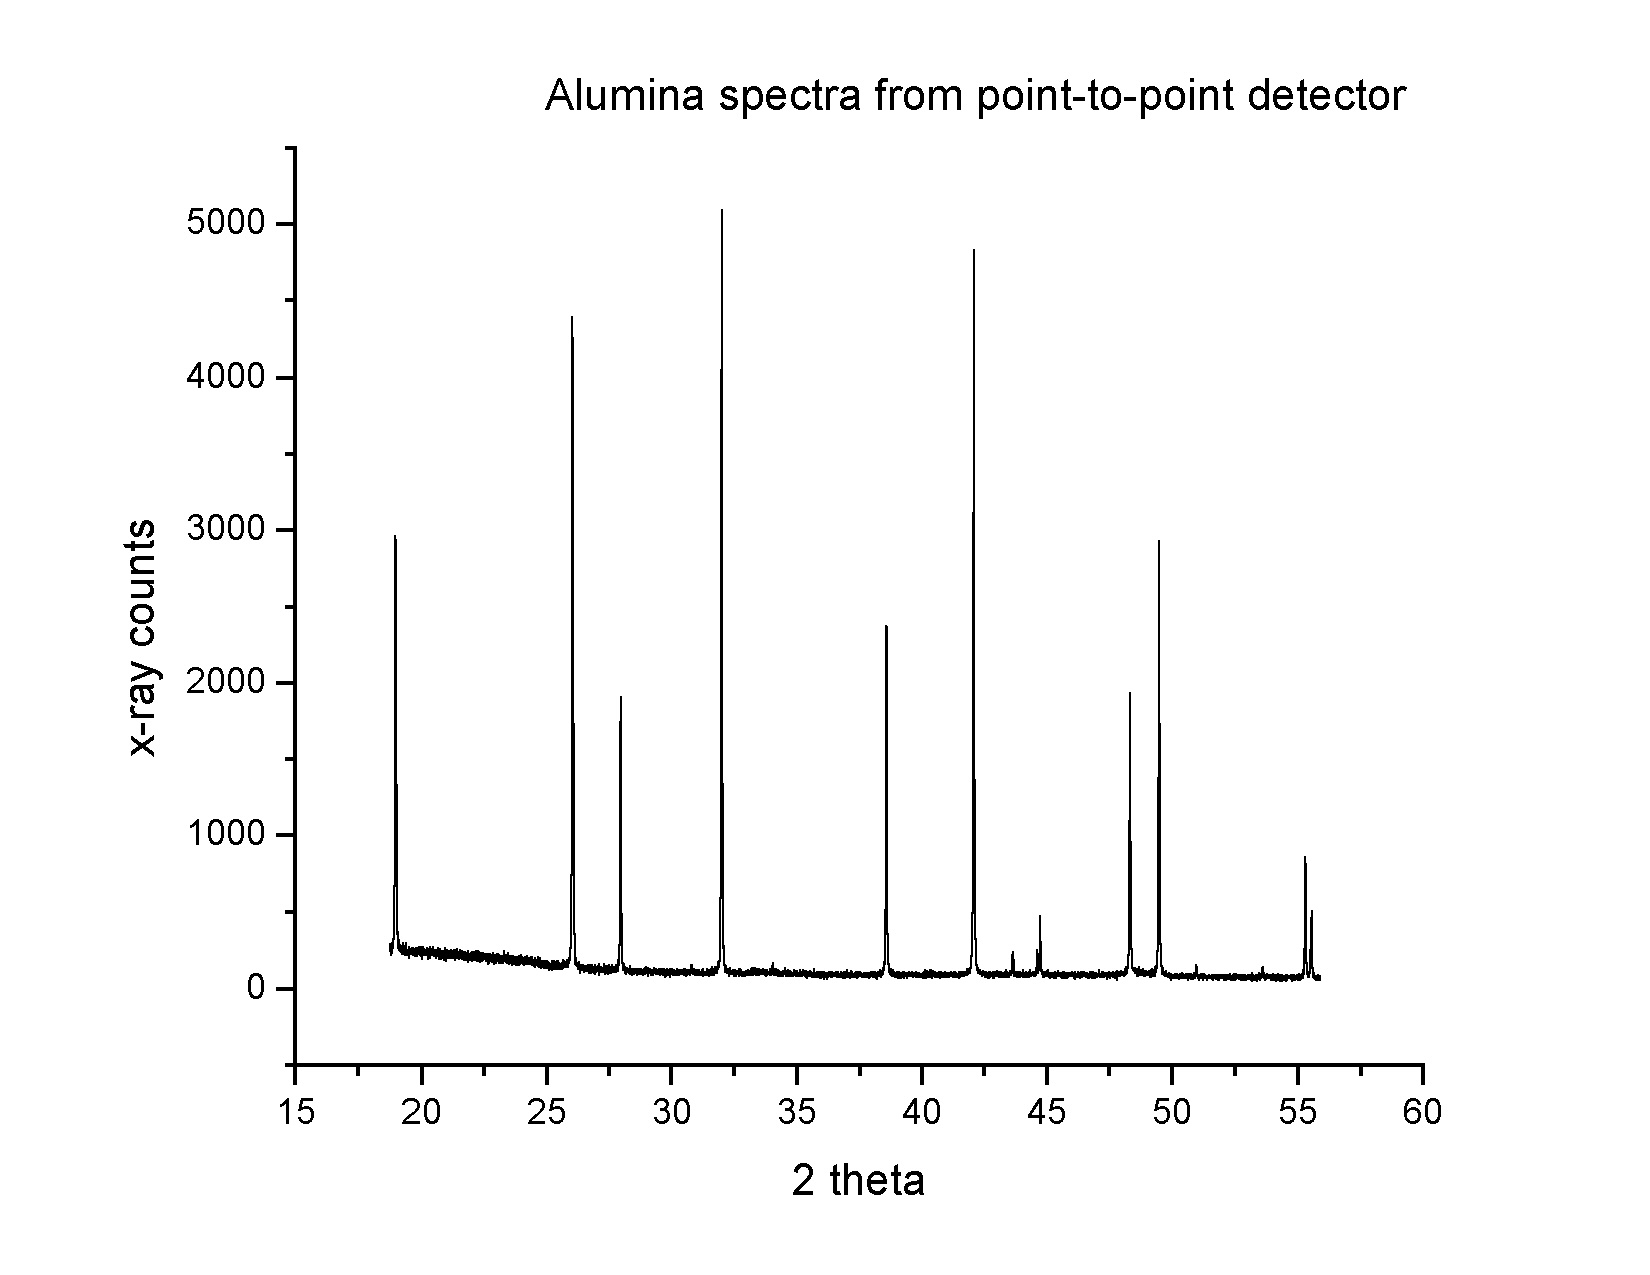
The following is an example of a spectrum for alumina obtained by a
point-to-point detector.
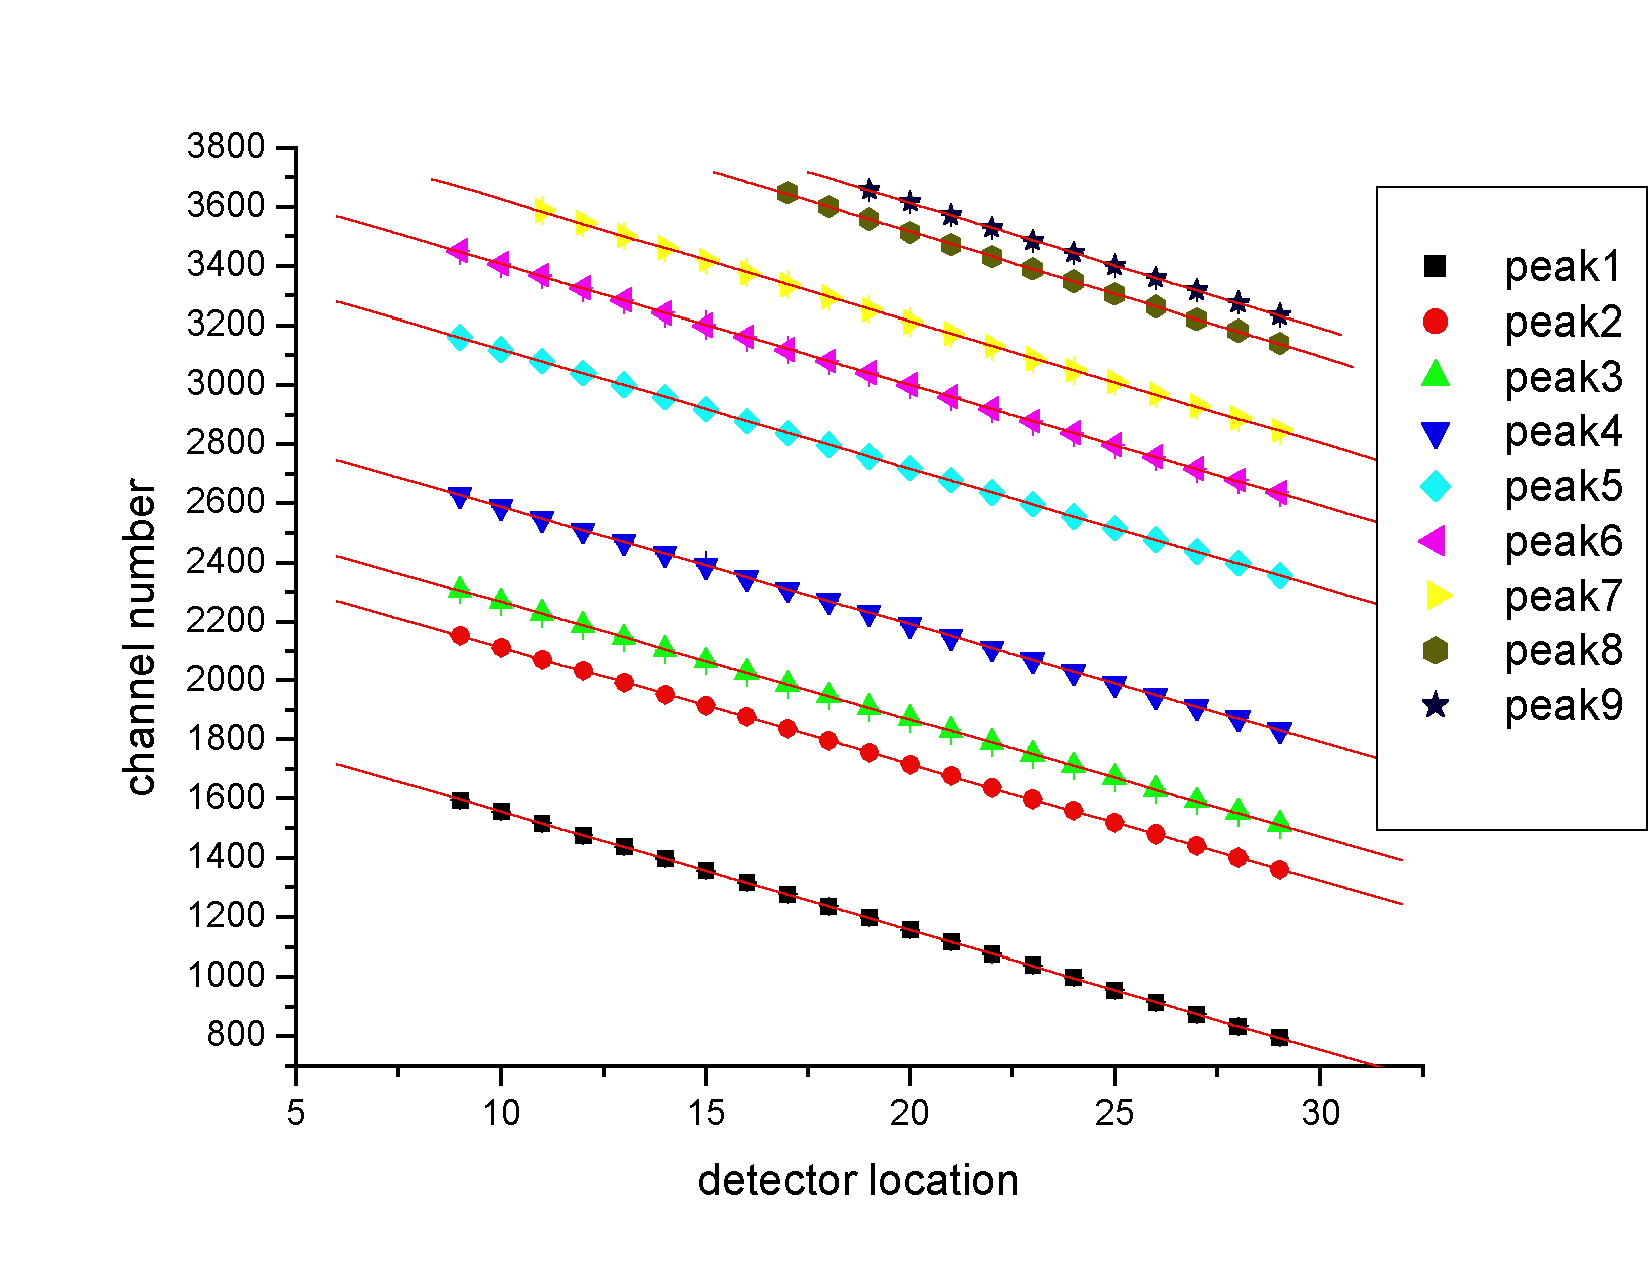
AnalysisEach peak of the twenty spectra was fit with a Gaussian and the peak
positions were obtained.
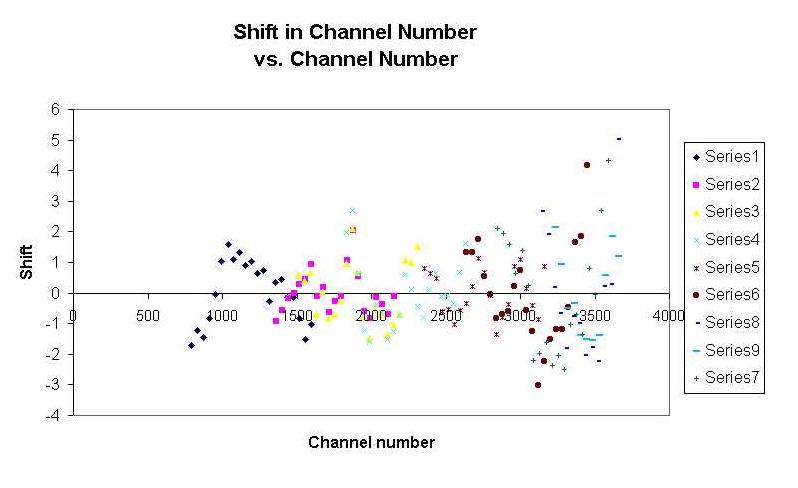
The deviation of each point from the linear fit was calculated and
plotted to get a sense of the linearity of the detector.
It can be seen from this graph that there is some nonlinearity within the detector. |